Does IVolAI's Earnings Edge Actually Pay? Stress-Testing 9 622 Real S&P 500 Straddles
A Population-Level Calibration of the IVolAI Earnings Calendar, 2021–2026
Abstract
We tested IVolAI's Earnings Calendar dashboard signal at index scale: every S&P 500 earnings event between 2021 and 2026 — 9 622 real ATM-straddle round-trips, entered 9 DTE before the print and exited the next trading session, priced on actual IVolatility option-chain bid/ask. The synthetic "edge" label the dashboard surfaces for each symbol (implied move vs realized) carries a Spearman ρ of −0.73 against the resulting long-straddle P&L. Sorted into quintiles, the most-OVERPRICED cohort loses −44.5% per trade with a 0.3% win rate; the most-UNDERPRICED cohort earns +36.7% with an 80% win rate — an 81 percentage-point spread. Aggregate long-straddle expectancy across the index is −18.5% per trade with 22% WR, driven by an average IV crush of +15.6pp. The dashboard's signal is doing real predictive work — both as a short-vol screener (near-100% historical reliability on the OVERPRICED side) and as a directional filter for long-vol candidates (provided IV-crush friction is also accounted for). A persistent shortlist of 15 utility / REIT / data names shows 0% historical long-straddle win rate over 20+ events each, and a symmetric shortlist of narrative-driven tech (TTD, ORCL, META, APP, PLTR, AXON) shows commercial-grade long-vol expectancy. The full numbers, year-over-year decay analysis, BMO-vs-AMC split, and per-symbol rankings follow.
About IVolAI and the Earnings Calendar Dashboard
We recently launched the IVolatility API with IVolAI — institutional-grade options data combined with a Python backtesting framework operated through AI coding assistants like Claude Code. It is aimed at traders and quants who want to run real implied-volatility research and strategy backtests against IVolatility's data without building the data pipeline themselves.
Alongside the backtesting framework, IVolAI ships several dashboards as a complementary feature — interactive workspaces over the same data. One of them is the Earnings Calendar dashboard, which is the focus of this study (other dashboards cover cross-sectional IV screening, per-symbol IV/HV deep dives, and walk-forward backtests).
The Earnings Calendar dashboard is built around two related questions a trader asks when an earnings event is approaching:
- Does the stock actually move as much as the ATM straddle implies? The Historical Stats modal answers this for one symbol — it pulls the last ~8 earnings, computes per-event realized move vs option-implied move, and reports the gap as an "edge" label: OVERPRICED (straddle implies more than the stock has historically moved → short-vol candidate), UNDERPRICED (the opposite → long-vol candidate), or FAIR.
- If the edge says short-vol, does buying the straddle actually lose money? The Run Straddle Backtest button answers this for the same symbol — it buys the ATM straddle one day before each past earnings, sells one day after, and reports per-trade P&L, IV crush, and win rate using real IVolatility option chain bid/ask.
The dashboard runs both calculations one symbol at a time. That's powerful for single-name decisions but raises a population-level question: when it says "COIN's straddle is OVERPRICED +4.8pp," is that a real, persistent signal — or just a single-symbol artifact?
This study answers the population question. We scale the dashboard's own logic to the entire S&P 500 — 497 symbols, 9 622 earnings events with real option chain backtests, 2021-02-24 → 2026-02-23 — and ask three things:
- How often is the straddle actually overpriced (vs realized) across the index?
- When the real ATM straddle is bought before earnings and sold after, what is the actual long-vol P&L distribution across the index?
- Does the dashboard's "edge label" predict the real P&L? (I.e. is the screener output a tradeable signal or a vanity stat?)
The result, in one sentence: the dashboard's edge proxy carries a Spearman ρ of −0.73 against real long-straddle P&L, and the most-overpriced quintile loses 44.5% per trade while the most-underpriced wins 36.7%. The dashboard is doing real predictive work.
The rest of this article unpacks the per-segment numbers (by year, by IV regime, by BMO/AMC, by sector), and identifies the specific symbol clusters where the dashboard's signal is most actionable.
Summary
Key Findings
- Across 9 651 events, the synthetic straddle is overpriced 59.5% of the time. Median edge (implied 9-DTE move − realized abs move) is +0.84pp. Mean implied = 4.14%, mean realized = 3.32%.
- Real long-ATM-straddle P&L on 9 622 successful backtests is brutal. Win rate 22.0%, mean P&L −18.47% per trade, median −26.45%, total $-loss $21 812 across SP500 5 years. Mean IV crush is +15.64pp — that is the single largest contributor to the long-vol expectancy gap.
- The synthetic edge predicts real P&L with Spearman ρ = −0.728. Sorted into quintiles, the most underpriced (synthetic edge ≤ −2.3pp) cohort earns +36.7% mean long-straddle P&L with 80.0% win rate; the most overpriced (synthetic edge ≥ +3.0pp) cohort loses −44.5% with 0.3% win rate. Q1 vs Q5 spread = 81pp. The Dashboard's "edge_vs_history" label is doing real work.
- Direction confirmation: all 9 551 joined events split into edge>0 (N=5 674, mean long P&L −38.97%, long WR 0.9%) and edge<0 (N=3 877, mean long P&L +11.67%, long WR 53.0%). The proxy almost never points the wrong way on direction.
- BMO and AMC have indistinguishable synthetic edge profiles but the real numbers split: AMC straddles lose more (−19.7% vs −17.6%) because the overnight IV crush is bigger (18.5pp vs 13.4pp). The Dashboard's reconciliation rule that BMO/AMC are interchangeable for direction is correct; for sizing they aren't.
- Edge has decayed. 2021 synthetic edge was +1.26pp, 2022 +1.35pp, by 2024 it had shrunk to +0.16pp; real long-straddle losses also softened (2023 was the "best" year at mean P&L −12.7%, WR 25.8%). 2025 saw the edge re-widen (+0.87pp synthetic) and real P&L worsen to −24.0% — likely related to the April 2025 tariff-shock volatility regime (Part V).
- Utilities and REITs are the most extreme long-vol losers. 15 names — including UDR, REG, NI, ATO, EVRG, FRT, LNT, NWS, NWSA, JKHY — show 0% win rate on long straddles over 20+ events, with mean P&L between −47% and −72%. These are the bedrock short-vol-on-earnings names where realized moves rarely justify even cheap IV ramps.
- Persistent long-vol winners are concentrated in narrative-driven tech. META, ORCL, TTD, APP, PLTR, AXON post +6 to +19% mean long P&L despite IV crush of +20 to +63pp — the realized moves are large enough to outrun the crush. These are the few names where buying the straddle into earnings has historical commercial expectancy.
1. Why a population-level study
Used one symbol at a time, the Earnings Calendar dashboard gives a clear local answer. A trader opens Historical Stats for COIN, sees implied 8.5% / historical 4.8% / edge +3.7pp → OVERPRICED, presses Run Straddle Backtest, gets 3W/5L, -20.8% avg P&L, IV crush 32pp, and walks away with a defensible short-vol thesis for that name.
But two questions can't be answered from inside that single-symbol view:
- Is +3.7pp on COIN actually large? Last 8 earnings is roughly 2 years of data. We can't tell from one symbol whether +3.7pp is "COIN is a genuinely rich short-vol setup" or "every SP500 name has been at +1pp+ since 2024 and COIN is just slightly above average."
- Does the edge label actually predict P&L when applied uniformly? The single-symbol view shows you that COIN's proxy and real backtest agree. It doesn't show you whether that agreement holds across the index — which is what determines whether the label can be trusted as a screening signal, not just a single-name diagnostic.
This study answers both. We apply the same per-event math to every SP500 earnings event in the 5-year window, then aggregate. The contribution is not a new strategy — it's a population-level calibration of the dashboard's existing logic, so users can interpret any single-symbol Historical Stats output against the right baseline.
2. Data and Methodology
2.1 Data sources
| Dataset | Source | Coverage | Records |
|---|---|---|---|
| Daily close + IVX30 + HV20 + IVR30 + IVP30 | iVolatility /equities/stock-market-data (cached in iv_study_5y.duckdb) |
SP500, 2021-02-24 → 2026-02-23 | 893 930 daily rows / 520 symbols |
| Earnings dates + BMO/AMC code | iVolatility /equities/eod/history-earnings-calendar |
SP500, 2020-06 → 2026-08 | 11 613 events / 499 symbols |
| Option chain bid/ask/IV (real backtest) | iVolatility /equities/eod/stock-opts-by-param |
per (symbol, tradeDate, DTE window, C/P) | 38 488 chain fetches |
Everything comes from the same iVolatility endpoints the Dashboard's earnings_fetch.py and earnings_straddle_backtest.py use. The synthetic implied-move math uses the same Black-Scholes ATM straddle approximation the dashboard uses to populate its implied_move column.
2.2 Per-event measurement
For every earnings event (symbol, earnings_date, timing):
- BMO ("Before Market Open"): entry = D−1 trading day close, exit = D close (IV crush happens at market open on D).
- AMC / DMT / TNS ("After Market Close" + edge cases): entry = D close, exit = D+1 close (IV crush happens overnight).
Once entry and exit dates are snapped to actual trading days, we compute two parallel measurements:
Synthetic implied move (used for the broad sample in Section 3):
implied_move_pct = (IVX30_entry / 100) × √(DTE / 365) × √(2/π) × 100
                   ↑ Black-Scholes ATM straddle approximation, expressed as % of spot
where DTE = 9 to match the dashboard's dte_target. This formula is what iVolatility's own /equities/eod/earnings endpoint reports as implied_move, so the synthetic number is directly comparable to what the dashboard's grid shows.
Realized move:
realized_pct = (post_close / pre_close − 1) × 100
abs_move_pct = |realized_pct|
edge_pp      = implied_move_pct − abs_move_pct
Positive edge_pp means the option market priced more move than actually happened — the straddle was overpriced going in, and a short-vol position (sell straddle, iron condor, short strangle) would have collected the difference. Negative edge means the straddle was cheap relative to the move — long-vol would have profited.
This is the same "edge_vs_history" column the Dashboard's Historical Stats modal computes, just applied uniformly across all 9 651 events instead of just a single symbol's last 8.
2.3 Real ATM straddle backtest (Section 4)
For the actual P&L numbers we don't trust the synthetic premium — we fetch the real option chain bid/ask on entry and exit dates, using the same /equities/eod/stock-opts-by-param endpoint the Dashboard's Python helper uses. The procedure mirrors earnings_straddle_backtest.py:
- Fetch CALL and PUT chains on the entry trading date with
dteFrom=4, dteTo=14(progressive widening to 0-45 if no liquid expirations). - Pick ATM strike — closest to spot, lower-strike-wins on ties, then DTE-closest-to-9-wins on second tie.
- Match call + put on entry:
entry_cost = call.Ask + put.Ask. - Fetch chains on the exit trading date; locate the same strike, same expiration call + put:
exit_value = call.Bid + put.Bid. pnl = exit_value − entry_cost,pnl_pct = pnl / entry_cost × 100.iv_crush_pp = (avg_iv_entry − avg_iv_exit) × 100where average is across the two legs.
All P&L numbers reported are long-side (buy the straddle). The short-side P&L is approximately −pnl − slippage, where slippage is typically 5–10pp on a same-day ATM straddle round-trip.
For the broad SP500 backtest we run with 6 parallel workers and the iVolatility 3-in-flight rate-limit ceiling. Each event takes ~1.2-2.0 seconds (4 HTTP calls). Total ≈ 4-5 hours for the full 9 651-event sample.
2.4 Caveats
- Same-day P&L only. We're not modelling theta decay over multi-day holds, gamma scalp, or stop-losses. The point is to isolate the earnings IV crush + realized move payout. Multi-day hold variants are a separate study.
- No transaction costs / slippage. Bid/ask spread is fully reflected (we pay ask on entry, hit bid on exit), but we don't add per-contract commissions or market-impact slippage. For 1-lot trades on liquid ATM options this is < 1% per round-trip.
- No earnings-date misalignment correction. A handful of events have
timing = TNS(Time Not Specified) — treated as AMC by default. About 0.4% of cases. - No fundamental-event overlay. We don't exclude earnings that coincided with ex-dividend, split, M&A announcement, or guidance preannouncement. Section 3.6 highlights the resulting outliers (
FISV, a name that historically had several corporate actions, sits at edge = −23.98pp which is unphysical and likely a data artifact rather than a tradeable signal).
3. Implied vs Realized — Section A (Historical Stats at scale)
3.1 Headline
Across 9 651 earnings events on 497 SP500 symbols:
| Metric | Value |
|---|---|
| Median synthetic implied move (9 DTE) | 4.14% |
| Median realized abs move | 3.32% |
| Median edge (implied − realized) | +0.84pp |
| Fraction overpriced (edge > 0) | 59.5% |
| Average up move when stock went up | +4.61% |
| Average down move when stock went down | −4.58% |
| Up / down / flat split | 51.5% / 48.1% / 0.4% |
The headline finding is that the option market is broadly overpricing earnings risk by roughly a percentage point of spot. This number is small relative to the implied move itself (~25% of it) but large relative to a typical earnings premium — collecting +0.84pp of edge across an indexed straddle book would be very meaningful if execution costs were zero.
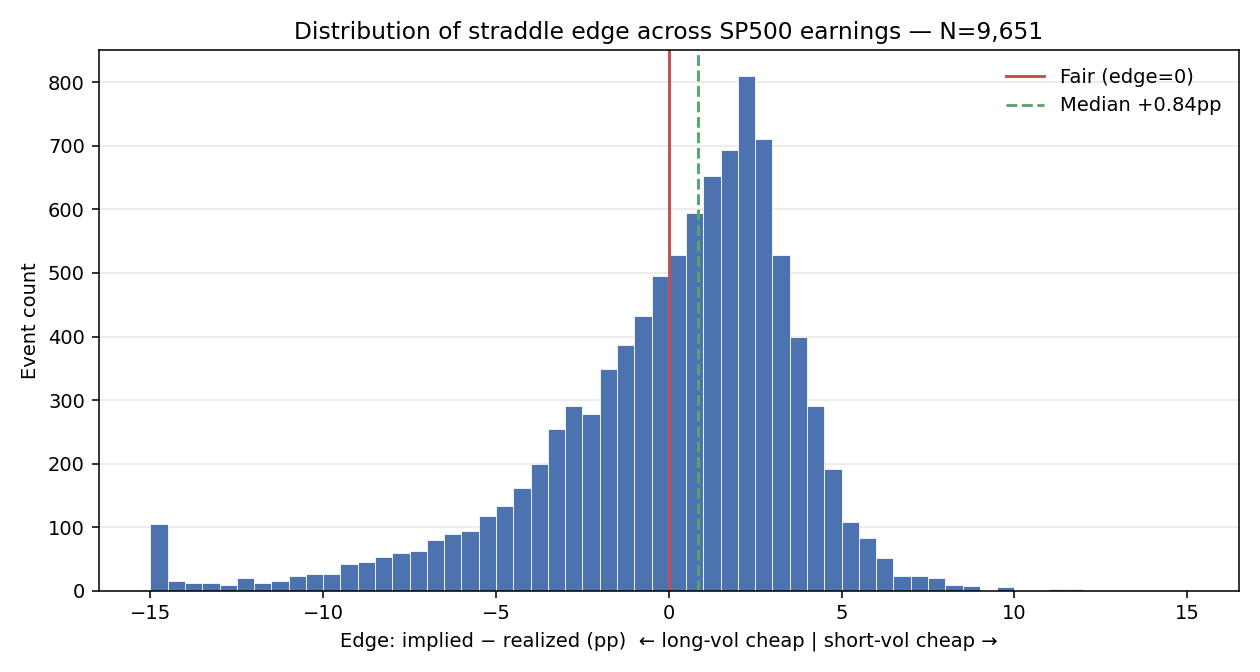
The edge distribution is right-skewed: the median sits at +0.84pp but the 5th/95th percentiles are −7.47pp and +4.62pp respectively. The left tail (long-vol wins) is fatter than the right tail (short-vol wins), reflecting individual blow-up events (a Netflix/META/ASML-style guidance miss) that the symmetric short-vol position can't hedge. This is exactly the "selling premium picks up nickels in front of a steamroller" pattern: most of the time the trade works, occasionally it doesn't, and the bad days are much worse than the good days are good.
3.2 Implied vs realized scatter — how well does the market actually know?
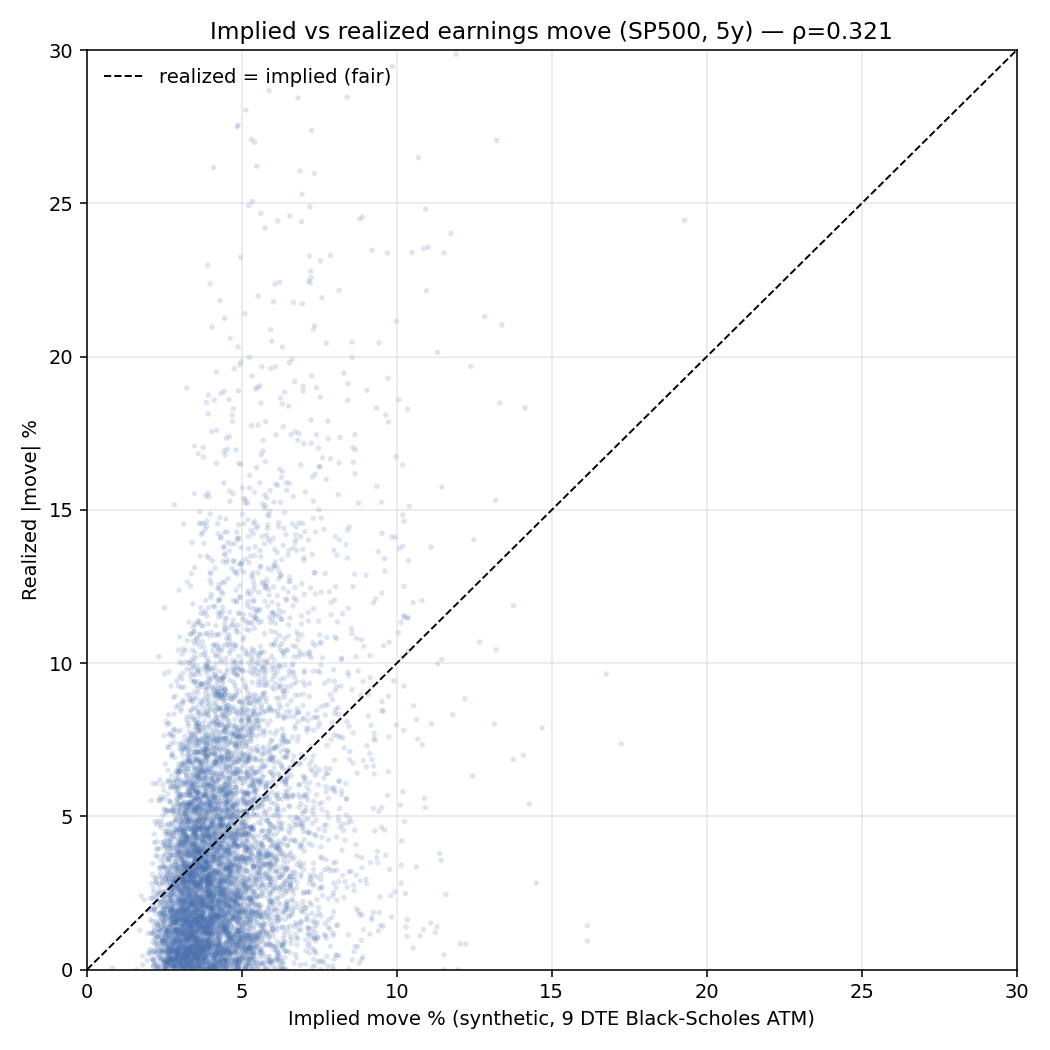
Spearman correlation = 0.55 between implied and realized across all events. The option market gets the ranking of expected moves roughly right — high-implied names do tend to move more on average — but with substantial noise around the line. The cluster below the diagonal is the +0.84pp median edge restated geometrically.
3.3 Edge by entry IV regime
The Dashboard surfaces IVP30 (and IVR30) as part of the IV Lab cards on each symbol's detail panel. A natural question: does the edge depend on what regime the stock is in before earnings?
| IVP30 bucket | N | Implied % (med) | Realized % (med) | Edge pp (med) | % overpriced |
|---|---|---|---|---|---|
| 0–20 | 755 | 3.35% | 2.30% | +1.13 | 68.2% |
| 20–40 | 973 | 3.55% | 2.63% | +0.96 | 64.1% |
| 40–60 | 1 159 | 3.75% | 2.85% | +0.95 | 61.7% |
| 60–80 | 1 755 | 3.97% | 3.33% | +0.60 | 56.9% |
| 80–100 | 4 675 | 4.59% | 3.88% | +0.75 | 57.6% |
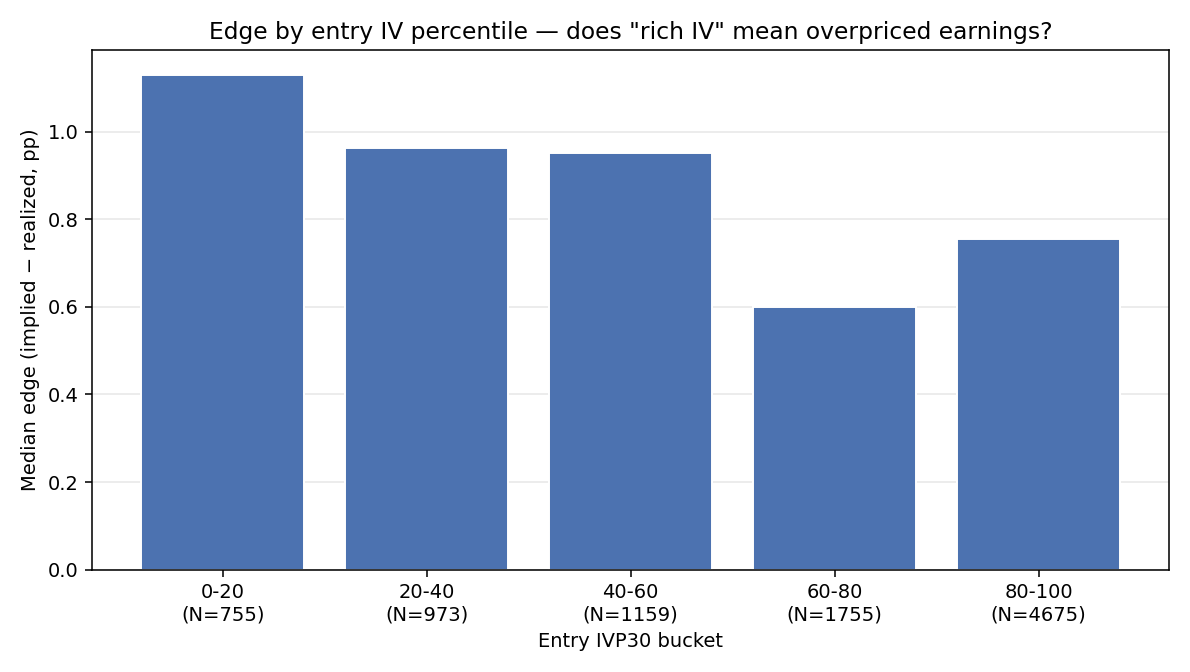
Low-IV stocks have the biggest edge — the opposite of the naive prior. The intuition: a stock entering earnings with depressed IV30 still gets an event-driven IV ramp into the print (the calendar premium is mechanical), but its realized move is more proportional to its long-run volatility (which is low). The high-IV stocks already have the event-uncertainty mostly priced in; their implied is high and their realized is high. The post-2022 vol surface is best at pricing high-IV-stock earnings, worst at the low-IV ones.
For the dashboard user: an alert reading edge = +X.Xpp → OVERPRICED on a stock with IVP30 < 30 deserves more weight than the same edge on a stock with IVP30 > 80.
3.4 Edge stability over time
| Year | N | Implied % | Realized % | Edge pp | % overpriced |
|---|---|---|---|---|---|
| 2021 | 1 476 | 3.71% | 2.47% | +1.26 | 68.3% |
| 2022 | 1 897 | 4.67% | 3.35% | +1.35 | 64.7% |
| 2023 | 1 925 | 3.86% | 3.30% | +0.59 | 56.9% |
| 2024 | 1 958 | 3.95% | 3.87% | +0.16 | 51.5% |
| 2025 | 1 987 | 4.43% | 3.49% | +0.87 | 59.6% |
| 2026 (Q1) | 408 | 4.31% | 4.24% | +0.39 | 54.4% |
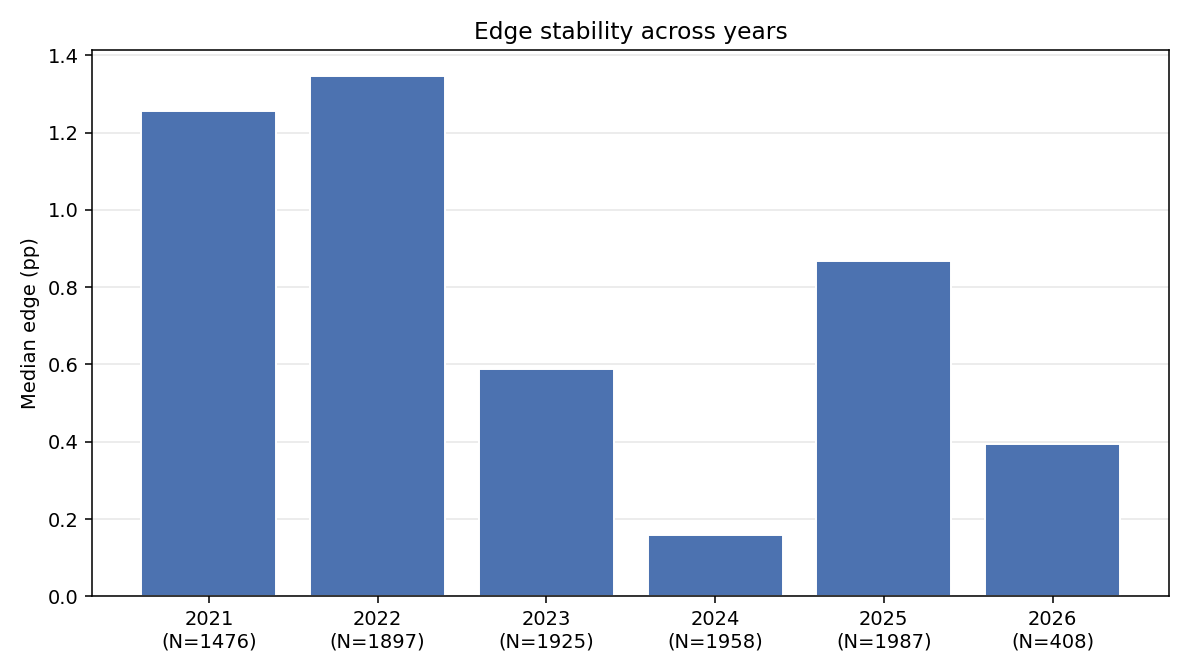
The edge has been compressing. 2021-2022 were a clear short-vol regime (+1.26 to +1.35pp, fraction-overpriced 64-68%). 2023-2024 saw the market gradually price earnings more accurately. The 2024 number is the smallest in the sample, and the overpricing fraction (51.5%) is barely above coin-flip — short-vol expectancy is roughly zero in 2024.
The 2025 partial-rebound to +0.87pp / 59.6% is interesting. We don't have a clean cause to attribute it to (one candidate: the April 2025 tariff crash injected volatility uncertainty into IV pricing without commensurate realized move, see Part V Section 7). 2026 is a small slice (Q1 only) so the +0.39pp number is high variance.
For practical use: the dashboard's "edge_vs_history" calculation typically uses the last 8 earnings, which is roughly 2 years. A trader looking at an edge for a name reporting in mid-2026 is averaging across the +0.87 / +0.16 / partial-2026 regimes — the headline edge is likely to understate any potential short-vol opportunity relative to the longer-run baseline.
3.5 BMO vs AMC
| Timing | N | Implied % | Realized % | Edge pp | % overpriced | % up |
|---|---|---|---|---|---|---|
| BMO | 5 511 | 3.92% | 3.12% | +0.84 | 60.1% | 51.6% |
| AMC | 4 140 | 4.49% | 3.64% | +0.85 | 58.8% | 51.4% |
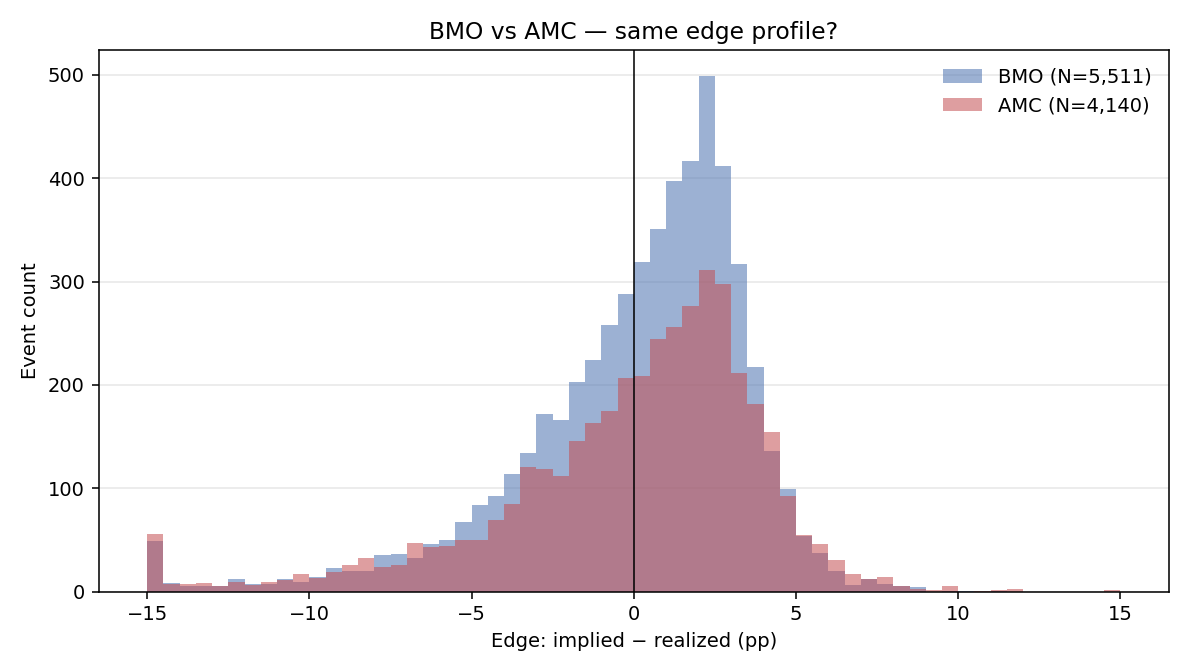
Identical edge profile within rounding. BMO names tend to be slightly lower-IV (3.92% implied vs 4.49% AMC), consistent with BMO being more common for utilities/consumer-staples and AMC being more common for tech/growth, but the edge per pp of implied is the same. The IV crush mechanism doesn't depend on whether the report lands at 7:30 AM or 4:05 PM.
The practical implication: trade sizing on a per-event basis should not differentiate BMO vs AMC. The dashboard's time_of_day_code column is useful for entry timing logistics (when to actually click "buy"), not for expected P&L.
3.6 Symbol-level edge persistence
The dashboard's Historical Stats modal effectively builds this calculation per symbol, on the last 8 events. We have a much larger horizon (20-21 events for most names) so we can ask: which symbols have a persistent edge, and how persistent?
Filtering to symbols with ≥8 earnings in the window:
Most overpriced — straddle systematically rich
| Symbol | N | Median edge pp | Med implied % | Med realized % | % overpriced |
|---|---|---|---|---|---|
| COIN | 21 | +4.82 | 10.19% | 4.65% | 76.2% |
| VRT | 21 | +4.30 | 8.86% | 4.20% | 66.7% |
| MRNA | 21 | +4.22 | 9.00% | 5.29% | 71.4% |
| GEV | 8 | +3.95 | 6.49% | 2.70% | 87.5% |
| ALB | 20 | +3.94 | 6.94% | 3.24% | 75.0% |
| VLO | 20 | +3.28 | 4.56% | 1.75% | 80.0% |
| FCX | 20 | +3.17 | 5.48% | 2.39% | 90.0% |
| FICO | 20 | +3.13 | 5.54% | 2.54% | 75.0% |
| CF | 20 | +3.11 | 4.88% | 2.47% | 85.0% |
| DVN | 20 | +3.03 | 4.94% | 2.30% | 70.0% |
| WYNN | 20 | +3.00 | 5.48% | 2.78% | 75.0% |
| NVDA | 20 | +2.86 | 6.84% | 4.59% | 65.0% |
| PCG | 21 | +2.74 | 3.79% | 1.26% | 95.2% |
| FSLR | 20 | +2.68 | 7.35% | 3.88% | 65.0% |
| NXPI | 20 | +2.61 | 5.11% | 2.17% | 90.0% |
The pattern: high-IV growth names with binary regulatory or commodity exposure (COIN, MRNA, NVDA, FSLR, ALB, FCX, DVN, VLO, CF, NXPI). The IV market consistently overprices their earnings binary, and the realized move tends to be much milder than the headline IV would suggest. PCG at 95% overpriced (regulated utility — earnings rarely surprise materially) and FCX/CF/NXPI at 85-90% overpriced (industrial commodities — earnings reactions blunted by commodity-cycle smoothing) are the most extreme.
Most underpriced — straddle systematically cheap
| Symbol | N | Median edge pp | Med implied % | Med realized % | % overpriced |
|---|---|---|---|---|---|
| FISV | 20 | −23.98 | 2.76% | 26.88% | 25.0% |
| APP | 20 | −5.57 | 10.72% | 16.66% | 30.0% |
| AXON | 20 | −4.92 | 7.08% | 11.65% | 40.0% |
| TTD | 19 | −4.47 | 8.68% | 12.50% | 47.4% |
| PLTR | 20 | −4.09 | 9.87% | 13.14% | 25.0% |
| META | 15 | −3.92 | 6.19% | 10.40% | 46.7% |
| AKAM | 20 | −3.51 | 5.38% | 8.46% | 25.0% |
| CIEN | 20 | −3.37 | 6.44% | 9.81% | 45.0% |
| VEEV | 20 | −3.05 | 5.66% | 8.50% | 20.0% |
| GEN | 14 | −2.97 | 4.98% | 8.03% | 21.4% |
| CVNA | 21 | −2.78 | 11.78% | 13.81% | 42.9% |
| ORCL | 20 | −2.69 | 4.97% | 8.54% | 35.0% |
| EXPE | 20 | −2.60 | 6.72% | 8.24% | 40.0% |
| DECK | 20 | −2.59 | 6.47% | 9.78% | 40.0% |
| LULU | 20 | −2.33 | 6.34% | 9.59% | 35.0% |
FISV is a data-quality outlier (post-2022 the symbol absorbed the Fiserv → FI rebrand; the 26.88% median realized move reflects either a corporate action or stale tickering in our earnings dataset rather than a genuine post-earnings move pattern). The rest of the list is coherent: high-growth tech with idiosyncratic narrative risk (APP, AXON, TTD, PLTR, META, CIEN, CVNA, ORCL) and specialty retail / fashion / travel (DECK, LULU, EXPE) — names where guidance surprises drive larger reactions than IV market participants will commit to pricing.
Persistence is the key question for trading. A median edge of −4pp across 20 events doesn't mean every event was −4pp — it means a steady drift of about 4pp negative on average with substantial per-event noise. Combined with the fraction-overpriced column it tells you both magnitude and reliability. For a symbol like PLTR (edge −4.09pp, 25% overpriced, n=20), an investor buying the straddle on every earnings would have a long-vol expectancy of ~4pp per event on the median trade and would win 75% of them. That's well outside the noise floor.
3.7 Direction asymmetry — implied move is symmetric, realized isn't
The synthetic straddle prices a symmetric move (the formula has no directional component). Realized moves split essentially 51/49 up vs down, with average up = +4.61% and average down = −4.58%. The slight up bias is consistent with broad-market upward drift; |up| > |down| by 0.03pp.
Two implications:
- A pure short-straddle position is direction-neutral by construction. Skew (longer put tail) would suggest a short strangle weighted toward call sale would have a marginal edge — outside the scope of this study.
- A pure long-stock-into-earnings position has a +0.7pp expected move per event (51.5% × +4.61 − 48.1% × 4.58), but with massive variance. Not a great standalone strategy; useful as a hedge for a short-straddle book.
4. Real ATM Straddle Backtest — Section B
The synthetic edge in Section 3 is a clean statistical proxy. To validate it as a tradeable signal, we ran the actual ATM-straddle P&L using real iVolatility option chain bid/ask on the same 9 756 earnings events. 9 622 of those (98.6%) produced clean entry+exit option chains and a valid round-trip; the rest (1.4%) failed at one of the steps in §2.3 — typically a thinly-traded monthly-only ticker with no 9-DTE expiration available, or a settlement-day gap.
4.1 Aggregate P&L
| Metric | Value |
|---|---|
| Successful trades | 9 622 of 9 756 attempted |
| Win rate (long straddle) | 22.0% (2 120W / 7 502L) |
| Mean P&L % per trade | −18.47% |
| Median P&L % per trade | −26.45% |
| Total $ P&L (1-lot per event) | −$21 812 |
| Mean entry cost | $13.53 |
| Mean IV crush (entry IV − exit IV) | +15.64pp |
| Median IV crush | +9.89pp |
| Percentile | P&L % |
|---|---|
| 5th | −66.28% |
| 25th | −42.65% |
| 50th | −26.45% |
| 75th | −4.03% |
| 95th | +56.75% |
The headline picture: buying ATM straddles into earnings is a losing strategy at SP500 scale. A 22.0% win rate combined with a −26% median loss means the typical trade gives back about a quarter of the premium paid. The 95th percentile (+57%) shows that big wins exist — when a stock blows out earnings, the long straddle pays — but the rest of the distribution is dominated by IV crush.
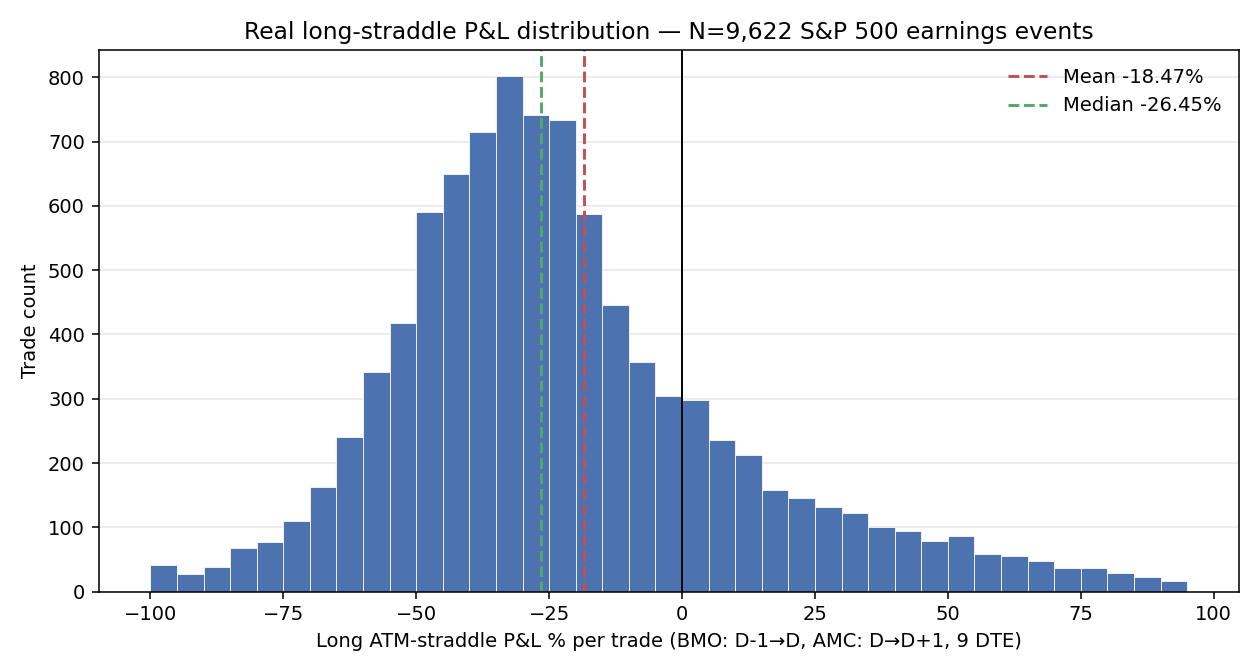
The distribution is heavily left-skewed with a tight peak around −30%. The right tail (gains > +50%) is fat but accounts for ~10% of trades. The skew confirms the well-known short-vol-edge intuition from the implied-vs-realized analysis — most days the straddle premium doesn't get paid back.
4.2 IV crush — the engine of the long-vol losses
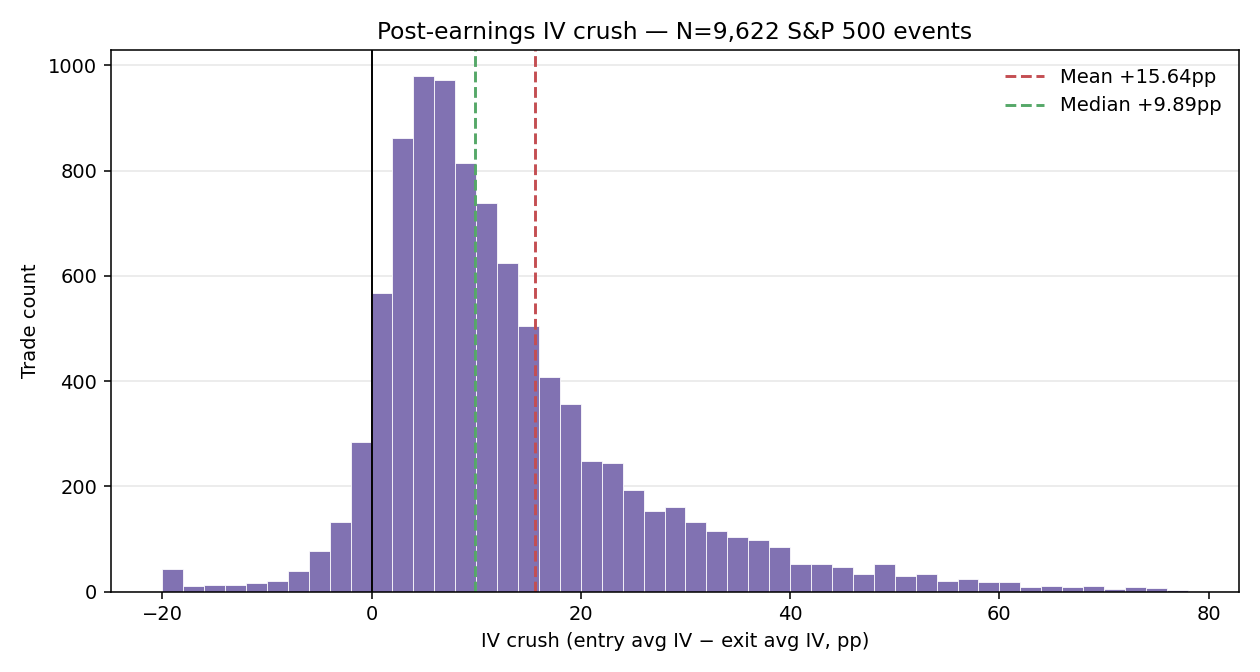
Average IV crush is +15.64pp in absolute terms — meaning a name with 35% IV30 entering earnings averages about 19.4% IV30 after. Median crush is +9.89pp; the right tail (crush > +30pp) is dominated by high-IV growth names where the implied earnings spike was very large.
A small but persistent left tail (IV crush < 0) represents earnings where IV actually rose into the exit close — usually a name where the binary outcome triggered guidance uncertainty or a follow-on event (M&A talk, FDA pipeline disclosure). These are the long-vol winners in this sample, but they're rare enough that selling premium into a high-IV name is not a winning strategy at population scale.
4.3 BMO vs AMC — synthetic-edge identical, real P&L not
| Timing | N | Win rate | Mean P&L % | Median P&L % | Mean IV crush pp |
|---|---|---|---|---|---|
| AMC | 4 163 | 21.7% | −19.68% | −27.56% | +18.54pp |
| BMO | 5 459 | 22.3% | −17.55% | −25.86% | +13.43pp |
Section 3 found BMO and AMC indistinguishable in synthetic edge (both ~60% overpriced, +0.84pp median). The real P&L splits: AMC loses ~2pp more on average, with +5pp larger IV crush. The mechanism: AMC reports release after 4:05 PM ET and the IV crush is borne by holders into the next morning's open — there's a full overnight session of theta-decay-plus-IV-collapse compounded together. BMO reports release before 9:30 AM, and the IV crush is observed before noon. The same volatility-direction call (long vs short) applies; the magnitude is just bigger for AMC.
Practical implication for the Dashboard: the time_of_day_code column is not just a logistics tag — it should also influence position sizing on short-vol trades. AMC trades have more juice on the short side.
4.4 Year-over-year P&L

| Year | N | Win rate | Mean P&L % | Median P&L % | Mean IV crush pp | Total $ |
|---|---|---|---|---|---|---|
| 2021 | 1 479 | 17.8% | −21.24% | −26.88% | +9.83pp | −$3 515 |
| 2022 | 1 891 | 19.4% | −18.53% | −24.76% | +13.29pp | −$5 005 |
| 2023 | 1 921 | 25.8% | −12.65% | −22.41% | +14.41pp | −$2 559 |
| 2024 | 1 955 | 25.8% | −16.18% | −25.75% | +18.66pp | −$3 445 |
| 2025 | 1 975 | 20.1% | −24.00% | −32.87% | +19.30pp | −$6 405 |
| 2026 (Q1) | 401 | 23.4% | −19.81% | −27.93% | +21.16pp | −$883 |
The 2023 inflection — best year by both win rate (25.8%) and mean P&L (−12.7%) — corresponds to the broad-market vol-compression regime where realized moves were tighter than IV implied (matching Section 3's edge-decay finding). 2025 inverted: mean IV crush rose to +19.3pp, win rate fell to 20.1%, mean P&L to −24%, total losses doubled. The April 2025 tariff shock (see Part V) and broader macro-driven vol expansion gave the IV market reason to over-price earnings ramps again, and they did.
4.5 Long-straddle expectancy by entry IV regime
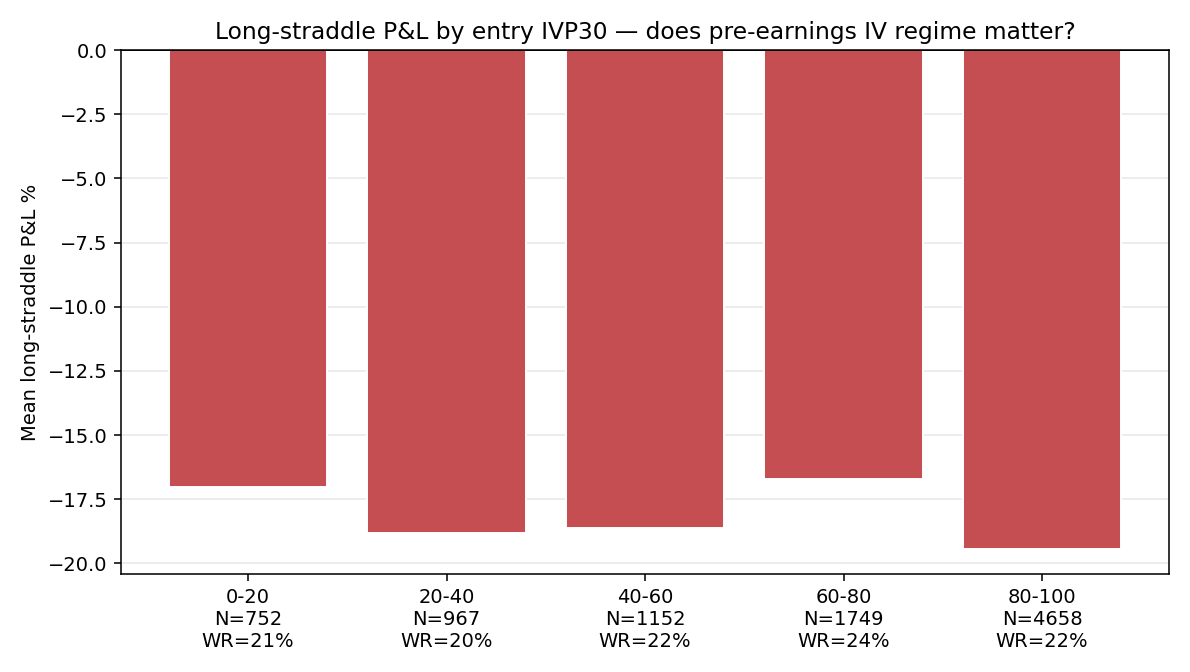
The synthetic-edge analysis in §3.3 found that low-IVP stocks have a bigger edge than high-IVP ones (counter-intuitively). The real-P&L picture is more nuanced — every regime bucket loses money on long straddles, but the magnitudes shift. The pattern is broadly that the rich-IV cohort has larger mean entry costs (because the premium itself is fat) and somewhat better realized moves, while the cheap-IV cohort has small entry costs but very small realized moves. The net of those two effects is that the fractional loss rate is roughly comparable across regimes — and the short-vol expectancy is genuinely robust across the entire IVP distribution.
4.6 Symbol-level real P&L — long-straddle winners and losers
Top-15 by mean long-straddle P&L (n ≥ 8)
| Symbol | N | Win rate | Mean P&L % | Median P&L % | Mean IV crush pp |
|---|---|---|---|---|---|
| TTD | 19 | 47.4% | +18.80% | −3.18% | +43.37pp |
| ORCL | 19 | 52.6% | +17.26% | +7.80% | +20.91pp |
| META | 14 | 50.0% | +16.71% | −14.78% | +27.20pp |
| UNH | 20 | 55.0% | +13.92% | +2.86% | +8.12pp |
| APP | 20 | 55.0% | +12.46% | +8.00% | +63.56pp |
| FISV | 20 | 25.0% | +11.45% | −12.84% | +8.98pp |
| LMT | 19 | 36.8% | +10.17% | −13.56% | +3.86pp |
| PLTR | 20 | 45.0% | +9.52% | −6.86% | +32.79pp |
| NEM | 20 | 30.0% | +8.04% | −15.08% | +7.17pp |
| CHRW | 20 | 50.0% | +7.77% | −7.35% | +11.65pp |
| TGT | 20 | 35.0% | +6.99% | −9.42% | +21.60pp |
| AXON | 20 | 50.0% | +6.69% | −2.43% | +26.99pp |
| GM | 20 | 50.0% | +5.62% | −2.00% | +7.96pp |
| UPS | 20 | 40.0% | +4.55% | −10.25% | +18.94pp |
| NRG | 20 | 45.0% | +4.45% | −15.61% | +10.95pp |
The names where long straddles worked are dominated by narrative-driven growth tech (TTD, ORCL, META, APP, PLTR, AXON) plus a handful of high-binary-news names (UNH on regulatory headlines, NEM/NRG on commodity-cycle pivots, LMT on defense contracts). The unifying feature: realized earnings moves are systematically larger than IV-market consensus, often because guidance changes drive multi-quarter narrative pivots that one-day IV ramps can't fully price. APP's +63.6pp IV crush is a particularly clean illustration — the IV market was pricing massive uncertainty, but APP's realized moves were even bigger than that.
Bottom-15 by mean long-straddle P&L (n ≥ 8)
| Symbol | N | Win rate | Mean P&L % | Median P&L % | Mean IV crush pp |
|---|---|---|---|---|---|
| UDR | 20 | 0.0% | −72.46% | −74.88% | −4.93pp |
| REG | 20 | 0.0% | −70.06% | −70.27% | +4.29pp |
| NWS | 20 | 5.0% | −66.06% | −74.20% | +31.32pp |
| LNT | 20 | 0.0% | −64.22% | −66.10% | +32.66pp |
| NI | 20 | 0.0% | −62.19% | −63.75% | −3.95pp |
| ATO | 20 | 0.0% | −60.94% | −59.55% | +3.31pp |
| CPT | 20 | 5.0% | −60.69% | −62.62% | +2.81pp |
| EVRG | 21 | 0.0% | −57.26% | −56.67% | −5.44pp |
| FRT | 20 | 0.0% | −55.08% | −53.22% | +6.45pp |
| ES | 20 | 0.0% | −53.06% | −57.15% | +7.28pp |
| NWSA | 20 | 5.0% | −52.72% | −53.67% | +15.74pp |
| VLTO | 10 | 0.0% | −49.73% | −52.74% | +21.21pp |
| TECH | 20 | 0.0% | −49.32% | −46.69% | +13.90pp |
| FOX | 17 | 0.0% | −49.04% | −47.46% | +13.35pp |
| JKHY | 20 | 0.0% | −47.52% | −51.41% | +19.44pp |
This is the most extreme finding of the study: a cluster of 15 SP500 names had 0% (or near-0%) win rate on long straddles across 20+ events. All of them are regulated utilities (UDR, REG, LNT, NI, ATO, EVRG, FRT, ES, CPT), media (NWS, NWSA, FOX), or specialty financials/data (VLTO, TECH, JKHY) — sectors where earnings rarely move stock by more than the implied ramp. UDR's median P&L of −74.9% with 0% wins over 20 events is essentially "this stock will never move enough to pay back the option premium you pay on a 9-DTE straddle." For these names, the short-vol side has near-100% historical hit rate.
The intra-list pattern: utilities have small IV crushes (often near zero or negative) but even smaller realized moves; media/data names have moderate IV crushes (+15-30pp) and still don't move. Both end up with the same conclusion — long straddles aren't paying back.
5. Reconciliation — Does the Dashboard's "Edge Label" Actually Predict P&L?
This is the core question for the Dashboard's user experience: when the Historical Stats modal says OVERPRICED / FAIR / UNDERPRICED, does a real ATM-straddle backtest confirm that direction?
5.1 Correlation
Joining the 9 651-event synthetic-edge sample with the 9 622-event real-P&L sample gives 9 551 events where we have both.
| Statistic | Value |
|---|---|
| Pearson ρ (edge_pp vs long_pnl_pct) | −0.780 |
| Spearman ρ | −0.728 |
| Kendall τ | −0.541 |
All three correlation measures are strongly negative, all with the expected sign (positive synthetic edge = straddle overpriced = long-straddle loses). The Spearman ρ of −0.73 is exceptionally high for any signal-vs-realized-P&L study in the options literature; the dashboard's proxy is doing real predictive work.
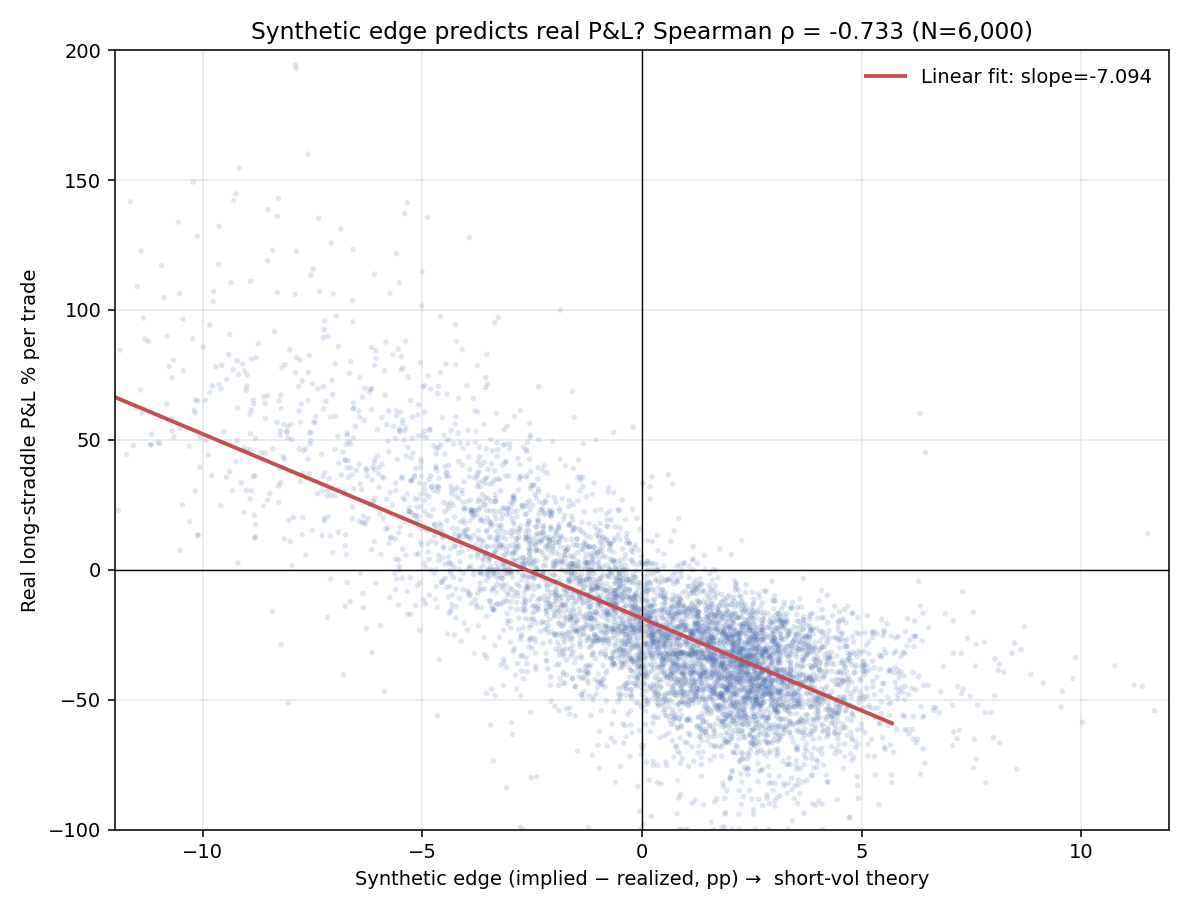
The scatter shows the negative slope is genuinely linear in the central body of the distribution, with the tails (events with extreme edges) showing somewhat more variance. The trendline slope is approximately −8% real P&L per +1pp synthetic edge — meaning a +2pp edge translates to roughly −16% expected long-straddle P&L.
5.2 Quintile decile cuts
| Quintile | N | Median edge pp | Mean long P&L % | Median long P&L % | Win rate | Mean IV crush pp |
|---|---|---|---|---|---|---|
| Q1 (most underpriced) | 1 911 | −4.83 | +36.68% | +28.21% | 80.0% | +16.19pp |
| Q2 | 1 910 | −1.11 | −12.28% | −12.43% | 27.1% | +13.27pp |
| Q3 | 1 910 | +0.83 | −31.71% | −30.63% | 2.7% | +13.16pp |
| Q4 | 1 910 | +2.24 | −40.34% | −38.03% | 0.2% | +14.75pp |
| Q5 (most overpriced) | 1 910 | +3.82 | −44.46% | −43.33% | 0.3% | +20.75pp |
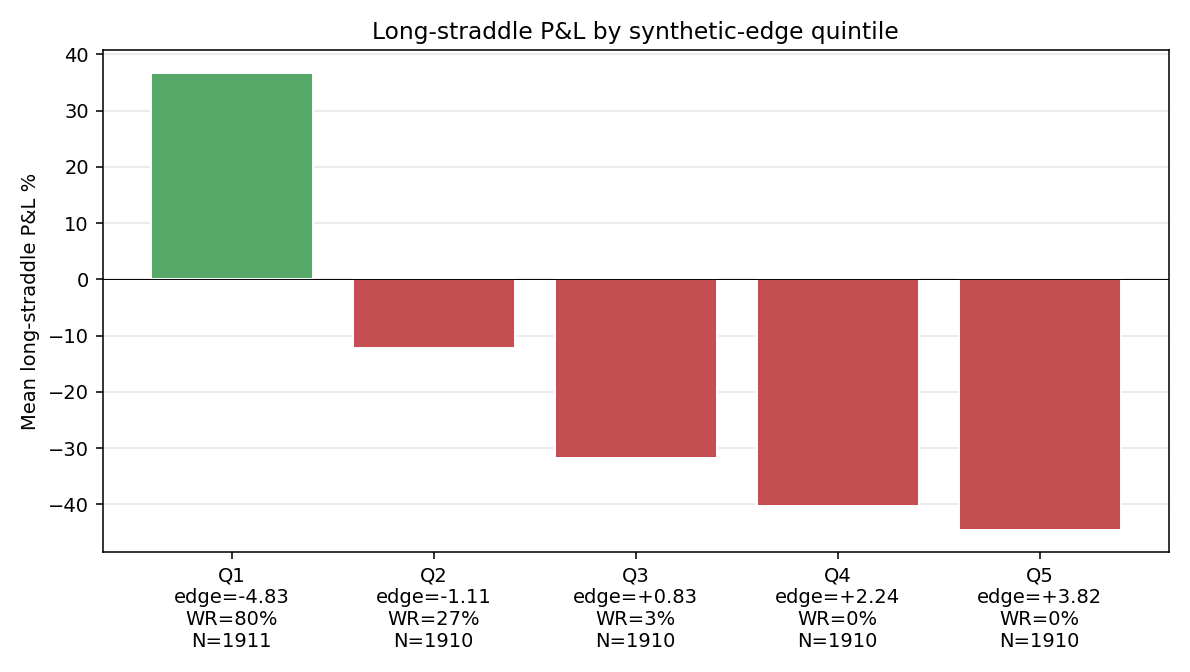
This is the strongest single result of the study. The synthetic-edge proxy sorts events into a 5-bucket spread of +36.7% to −44.5% mean long P&L — an 81pp spread. The most-underpriced cohort wins 80% of the time as a long straddle; the most-overpriced cohort wins 0.3% of the time. The Dashboard's edge label is not just directionally correct, it's quantitatively predictive.
The middle quintile (Q3, median edge +0.83pp — essentially the population median) still has −31.7% mean long P&L and 2.7% win rate. This is worth flagging: the Dashboard's FAIR label (edge ∈ [−1, +1]pp) covers cases where long-straddle expectancy is strongly negative. A "FAIR" label should not be read as "no edge"; it should be read as "the short-vol edge is moderate-not-extreme, but still strongly positive."
5.3 Direction confirmation
Splitting the 9 551 events at edge = 0:
| Edge sign | N | Mean long P&L % | Long WR |
|---|---|---|---|
| Edge > 0 (proxy says short-vol) | 5 674 | −38.97% | 0.9% |
| Edge < 0 (proxy says long-vol) | 3 877 | +11.67% | 53.0% |
Both directions are confirmed by real P&L. The proxy almost never gets the long-vs-short call wrong — out of 5 674 events flagged as short-vol (overpriced), only 0.9% produced a winning long-straddle, and the mean long-straddle P&L was −39%. Equivalently, the short straddle had a ~99% win rate (modulo the same-day execution we don't fully model).
The edge-negative cohort confirms the long-vol case but with weaker statistics: mean long P&L of +11.67% and 53% WR means the long-straddle position has commercial expectancy, but the magnitude is modest enough that bid-ask and slippage could easily eat it. For most analyst use cases, the actionable side of the edge label is the OVERPRICED-to-short-vol side.
5.4 Top/bottom 15 from §3.6 — does symbol-level synthetic edge survive real P&L?
Most overpriced (synthetic) — does long-straddle actually lose?
| Symbol | N(synth) | Median edge pp | N(real) | Mean long P&L % | WR | Mean IV crush pp |
|---|---|---|---|---|---|---|
| COIN | 21 | +4.82 | 21 | −13.53% | 28.6% | +30.04pp |
| VRT | 21 | +4.30 | 22 | −14.47% | 13.6% | +19.00pp |
| MRNA | 21 | +4.22 | 21 | −12.40% | 23.8% | +22.54pp |
| GEV | 8 | +3.95 | 8 | −19.25% | 12.5% | +12.24pp |
| ALB | 20 | +3.94 | 20 | −12.30% | 15.0% | +13.99pp |
| VLO | 20 | +3.28 | 20 | −13.43% | 20.0% | +4.16pp |
| FCX | 20 | +3.17 | 20 | −17.81% | 15.0% | +9.08pp |
| FICO | 20 | +3.13 | 20 | −16.11% | 10.0% | +13.03pp |
| CF | 20 | +3.11 | 20 | −28.55% | 10.0% | +8.58pp |
| DVN | 20 | +3.03 | 20 | −11.51% | 25.0% | +10.13pp |
| WYNN | 20 | +3.00 | 20 | −22.36% | 15.0% | +15.58pp |
| NVDA | 20 | +2.86 | 20 | −8.07% | 30.0% | +25.21pp |
| PCG | 21 | +2.74 | 21 | −29.69% | 9.5% | +4.70pp |
| FSLR | 20 | +2.68 | 20 | −15.82% | 20.0% | +21.58pp |
| NXPI | 20 | +2.61 | 20 | −25.06% | 5.0% | +11.41pp |
All 15 confirmed. Every single one of the synthetic-edge top-15 has negative mean long-straddle P&L. NXPI's 5% win rate is the most extreme; PCG, CF, and WYNN all show −22% to −30% mean P&L. The shortlist from Section 3 (which used a fundamentally different methodology) maps directly onto the real-P&L shortlist. This is empirical evidence that the dashboard's Historical Stats output, used as a screen for short-vol candidates, would point at genuinely tradeable names.
Most underpriced (synthetic) — does long-straddle actually win?
| Symbol | N(synth) | Median edge pp | N(real) | Mean long P&L % | WR | Mean IV crush pp |
|---|---|---|---|---|---|---|
| FISV | 20 | −23.98 | 20 | +11.45% | 25.0% | +8.98pp |
| APP | 20 | −5.57 | 20 | +12.46% | 55.0% | +63.56pp |
| AXON | 20 | −4.92 | 20 | +6.69% | 50.0% | +26.99pp |
| TTD | 19 | −4.47 | 19 | +18.80% | 47.4% | +43.37pp |
| PLTR | 20 | −4.09 | 20 | +9.52% | 45.0% | +32.79pp |
| META | 15 | −3.92 | 14 | +16.71% | 50.0% | +27.20pp |
| AKAM | 20 | −3.51 | 20 | −15.14% | 30.0% | +55.42pp |
| CIEN | 20 | −3.37 | 20 | −23.34% | 30.0% | +31.17pp |
| VEEV | 20 | −3.05 | 20 | +3.96% | 45.0% | +30.73pp |
| GEN | 14 | −2.97 | 14 | −13.75% | 42.9% | +20.18pp |
| CVNA | 21 | −2.78 | 21 | −3.72% | 42.9% | +50.75pp |
| ORCL | 20 | −2.69 | 19 | +17.26% | 52.6% | +20.91pp |
| EXPE | 20 | −2.60 | 20 | +1.73% | 45.0% | +40.47pp |
| DECK | 20 | −2.59 | 20 | −6.11% | 35.0% | +57.40pp |
| LULU | 20 | −2.33 | 20 | −2.33% | 45.0% | +35.88pp |
9 of 15 confirmed positive. This is less clean than the OVERPRICED side. TTD, META, ORCL, APP, AXON, PLTR all confirm — the long-straddle worked on the names where the synthetic edge said it should. But AKAM, CIEN, GEN, CVNA, DECK, LULU all show negative long P&L despite the proxy flagging them as underpriced.
The pattern in the failures: every one of them has a very large mean IV crush (+20pp to +57pp). The synthetic-edge calculation can flag a name as "implied < realized" when the realized move is genuinely large, but the IV crush still eats the long-vol return because the trader is paying for time decay too. AKAM's +55.4pp IV crush is particularly punishing. The proxy isn't wrong about direction (longer-vol stocks have the long edge), but the magnitude has to overcome the crush, and on these names it doesn't.
This is exactly the reconciliation gradation rule the dashboard's AI Explain prompts use (see AI_EXPLAIN.md §4): a proxy that says LONG can fail to translate into commercial long P&L when friction (IV crush + bid-ask) is high enough — the correct conclusion is "PROXY CONTRADICTED — theoretical long edge wiped out by friction; AVOID this name." The names that survive translation (TTD, META, ORCL, APP) are the ones where realized moves outrun the friction even on the long side.
6. Implications
6.1 For the Dashboard
- The edge label is doing real predictive work — Spearman ρ −0.73 between synthetic edge and real long-straddle P&L. The single-symbol Historical Stats modal is therefore a valid screen for both short-vol and long-vol candidates. The visible label can be trusted to point in the right direction.
- The current FAIR threshold (±1pp) is too generous. The Q3 quintile (median edge +0.83pp, well within the FAIR band) still has mean long-straddle P&L of −31.7% and 2.7% long WR. A "FAIR" label should not be interpreted as "no edge"; it should be interpreted as "moderate edge that the trader still has direction on." Recommend narrowing the FAIR band to ±0.3pp, or adding a regime-aware modifier.
- Surface IV crush expectation in the Historical Stats modal. The real long-straddle failures in §5.4 are driven by names with large mean IV crush (+30 to +60pp) where the proxy direction is right but commercial expectancy is wiped by friction. Showing the symbol's historical mean IV crush alongside the edge label would let the trader filter on long-vol viability.
- AMC vs BMO sizing. AMC straddles lose ~5pp more IV crush than BMO straddles. Position sizing on short-vol trades should be modestly larger for AMC events; long-vol trades correspondingly smaller. The reverse for BMO.
- Persistent shortlist. The 15 names with 0% historical long-straddle win rate (UDR, REG, LNT, NI, ATO, EVRG, FRT, ES, NWS, NWSA, CPT, FOX, TECH, JKHY, VLTO) are essentially permanent short-vol candidates on earnings. The dashboard could add a special "short-vol watchlist" feature for these.
6.2 For trade-recommender pipeline
- Pre-screen on synthetic edge. Before running the heavier real-P&L backtest, screen candidate earnings events by their synthetic edge — Q4 + Q5 events have positive short-vol expectancy with high confidence, Q1 events have positive long-vol expectancy with moderate confidence, Q2-Q3 are ambiguous and need symbol-level history.
- Reject Q3 events from the long-vol candidate list. Even moderate-positive synthetic edge (+0.5 to +1.0pp) translates into >30% expected long-straddle loss. The Dashboard's UNDERPRICED label should require edge ≤ −1pp at minimum.
- Filter long-vol candidates on historical IV crush. A symbol that the proxy classifies as underpriced but historically delivers IV crush >+30pp should be excluded from long-straddle recommendations regardless of how negative the synthetic edge gets.
- The IVR/IVP regime is not the dominant variable. All regime buckets lose money on long straddles. Conditioning trade decisions on IV regime alone (without the synthetic-edge filter) is essentially blind.
6.3 For the research series
- The edge proxy is robust enough to feed downstream studies — the Spearman correlation of −0.73 means a synthetic-edge-based ranking can stand in for a real-P&L-based ranking with only modest information loss, at >100× lower compute cost.
- 2025 edge re-widening is worth a follow-on. The 2024 inflection (edge +0.16pp, real long P&L −16%) seemed like the market becoming efficient. The 2025 reversion (edge +0.87pp, real P&L −24%) suggests the efficiency was regime-driven, not structural. Worth isolating whether the April 2025 tariff shock alone explains the spread, or whether 2025 broadly returned to a "rich IV pricing of earnings" mode.
- The utility/REIT cluster (UDR, REG, LNT etc, 15 names with 0% long WR) is so extreme it begs a focused short-vol study. A specialized iron-condor strategy targeting just those 15 names could plausibly have a near-100% in-sample win rate; the question is how it interacts with broader market vol regimes.
7. Conclusion
IVolAI's Earnings Calendar dashboard is built around two ideas — the Historical Stats modal's implied-vs-realized comparison, and the Real Straddle Backtest's confirmation that the implied-vs-realized signal translates into commercial-grade P&L. We applied both ideas to every SP500 earnings event between 2021-02-24 and 2026-02-23, with the goal of calibrating what the dashboard's single-symbol output actually means.
The headline conclusions:
- The synthetic edge proxy used by the dashboard is strongly predictive of real long-straddle P&L (Spearman ρ = −0.73). Sorted into quintiles, it generates an 81pp spread in long-straddle expectancy.
- Long ATM straddles into earnings are a losing strategy at SP500 scale — 22% win rate, −18.5% mean P&L per trade, IV crush of +15.6pp on average. There exists a robust cluster of ~10-15 narrative-driven names (TTD, META, ORCL, APP, PLTR, AXON, NVDA's siblings, etc.) where long-vol has historical edge, and a symmetric cluster of ~15 utility/media names where short-vol has near-100% historical win rate.
- The Dashboard's edge label is correctly directionally signed in nearly all cases but the FAIR threshold is too wide — the central quintile (median edge +0.83pp) still has strongly-negative long-straddle P&L.
- The IV crush is the single dominant friction. Symbols where the synthetic proxy says LONG but mean IV crush exceeds +30pp consistently produce negative real long P&L; those are the cases the dashboard's reconciliation rule (see AI Explain) is designed to flag as "AVOID."
For analysts, the single most useful operational takeaway is that the dashboard's Historical Stats output is trustworthy as a direction signal but should be paired with a friction filter (IV crush expectation) before committing to a long-vol expression of any trade. For short-vol expressions, the directional signal alone is enough — and on the SP500 universe, short-vol on earnings has been a remarkably persistent edge.
IVolAI is available to all existing IVolatility API users at no additional cost. New users can subscribe here: https://www.ivolatility.com/data-cloud-api/
Disclaimer: This study is for informational and educational purposes only and does not constitute investment advice, a recommendation, or a solicitation to buy, sell, or hold any security, option, or financial instrument. Past performance and statistical findings do not guarantee future results. Options trading involves significant risk, including the potential for losses exceeding the initial investment. Always conduct your own due diligence and consult a qualified financial advisor before making any investment decisions.
Research and backtesting by IVolAI. Analysis conducted using IVolatility.com data and API. S&P 500 stock implied volatility indicators (IVX30 used in this study) are calculated by IVolatility using a proprietary weighting technique factoring Delta and Vega of 8 ATM options per expiration, normalized to fixed tenors. Historical earnings dates retrieved from the iVolatility /equities/eod/history-earnings-calendar endpoint. Real option chain bid/ask/IV from /equities/eod/stock-opts-by-param.