Daily vs. Weekly vs. Monthly Time Value
August 26, 2024
The Markets at a Glance
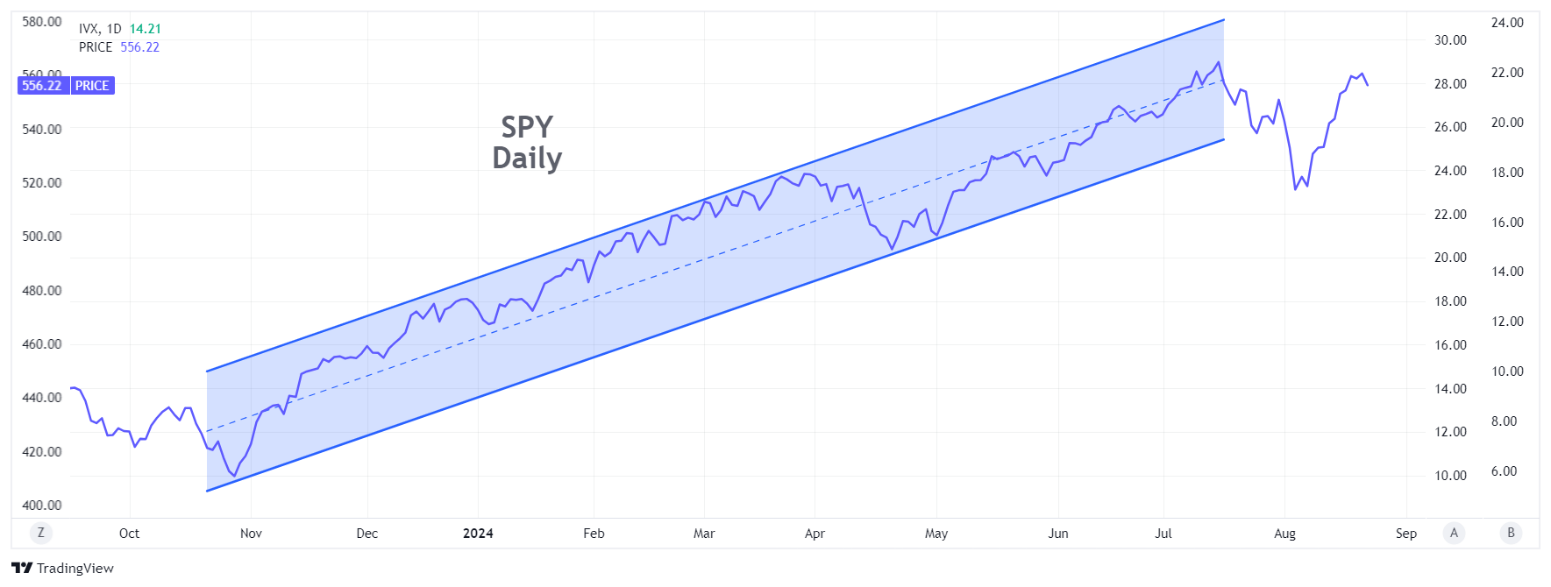
The July correction now appears to have been a quick reset rather than the beginning of a larger decline, as it has largely been recovered in August as quickly as it came down. However, the SPY has stalled before making a new high and whatever this larger trend turns out to be doing, it is clearly not still in the bullish channel from Oct '23 to July '24.
In addition, the good news that the Fed is open to cutting rates is now out and the soft landing scenario appears to be acknowledged by most investors. So, the market may be assuming the best scenario possible right now.
For the fall, the story is less certain, and we are coming into the lowest volume period of the year, which will tend to keep things from getting too bullish. The tech stocks that drove the prior rally have recovered some, but are not moving up with the same vigor as before, and if the Fed wants to wait after this first rate reduction (a likely scenario) before dropping rates any further, then the market could easily stall here for a while.
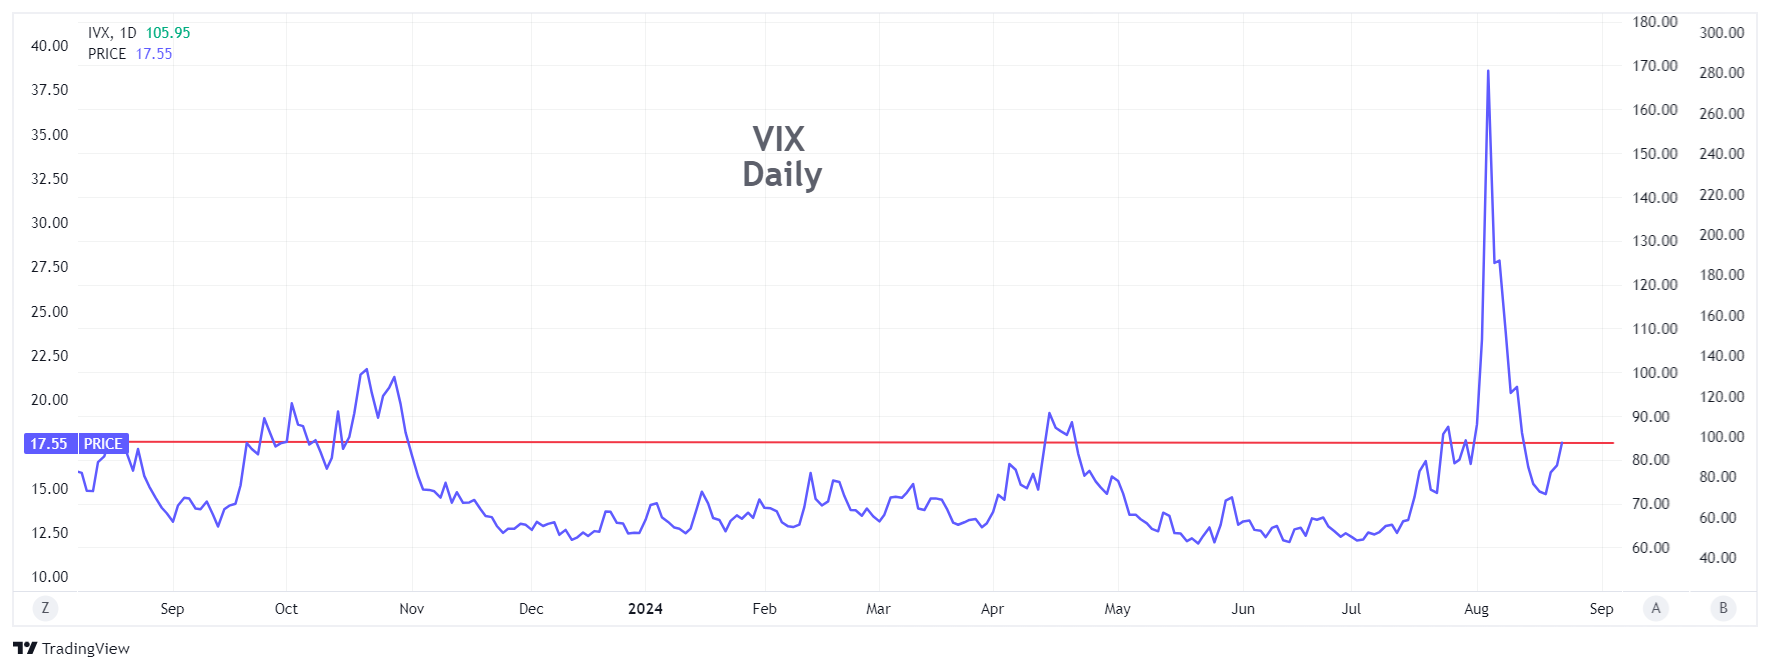
Meanwhile, implied volatility (as measured by VIX) is still in the high-teens, which is much different that the 11-12 range it was in for much of the past year. That says that institutions are still being cautious here. The good news is that makes option writing still attractive here.
Strategy talk: Writing Daily vs. Weekly vs. Monthly
Option writers should all have the classic time value decay curve implanted in their memories. Investopedia's version looks as follows:
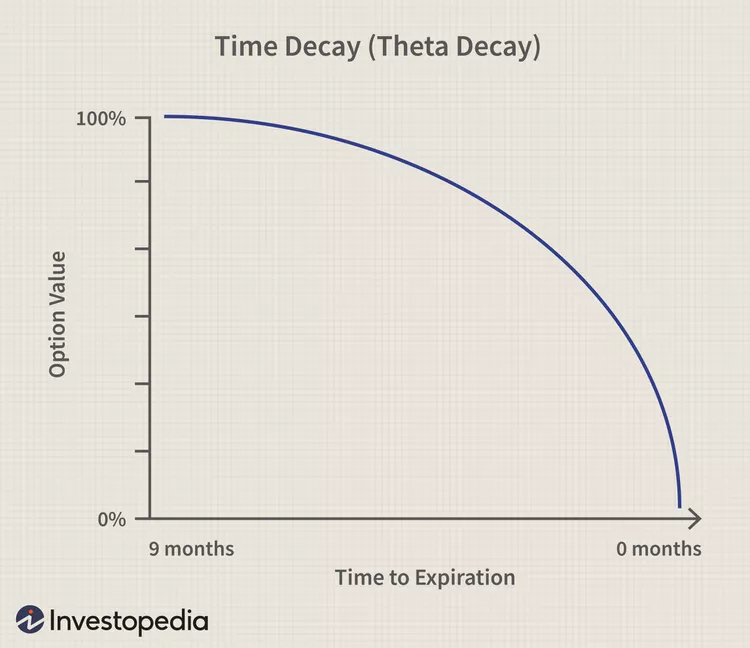
And the standout feature of time value decay is of course that it is non-linear and decays with the square root of time. That means an option decays at a faster rate as it approaches expiration - a feature that option writers can exploit by repeatedly writing shorter duration options.
There's no secret to the fact that writers (largely the pros and the institutions) have consistently lobbied the exchanges to list shorter durations, and that retail speculators are happy to have them as well.
As a result, weeklys have become quite popular, but at present, the only daily option expirations are on SPX, NDX, SPY, and QQQ. While traders like to write calls on individual stocks with higher implied volatility, writing daily options on SPY and QQQ can also be an attractive strategy, albeit one that requires a lot more attention.
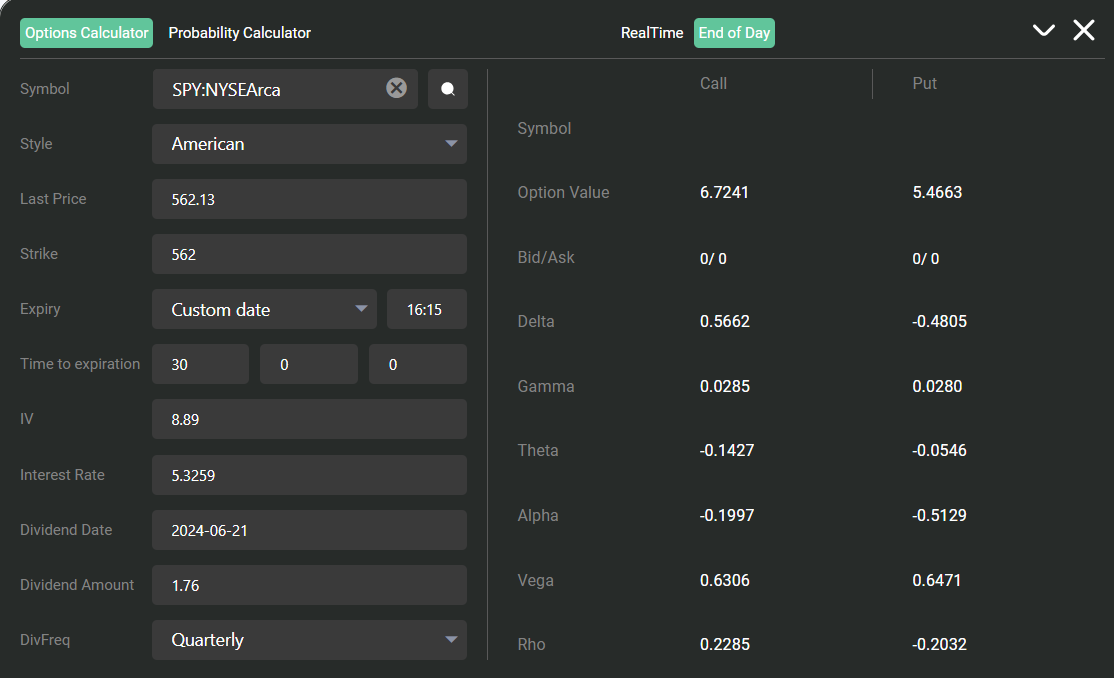
SPY and the QQQ thus offer a unique situation - a low volatility equity play with the ability to write options as often as daily. Using the IVolatility Options Calculator (screen shot shown below), I looked at theoretical call option premiums for an ATM call on SPY with 1-day, 5-day, and 30-day expirations. The results are as follows:
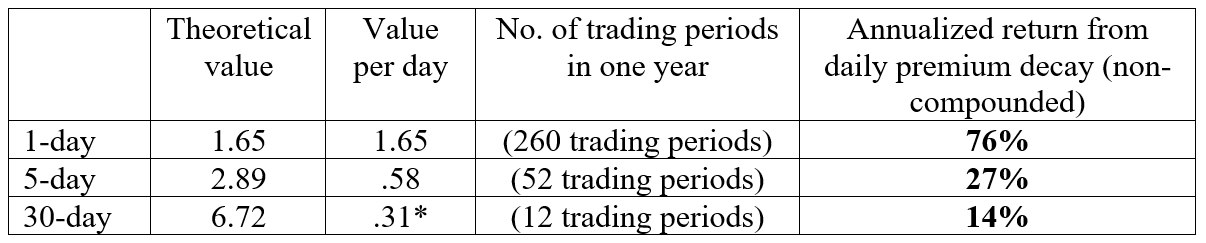
Note: 30 calendar day periods will include at least 8 weekend days, which cannot be separately traded. So, the value per day for the 30-day call is adjusted to 22 trading days when calculating the value per day.
Option writers will typically look to generate returns from a combination of capital appreciation, time premium decay, and dividends. While some stock or ETF holders may view small daily or weekly option premiums as too small to bother with or as a cap to potential upside, it should be noted that short duration premiums can add up quite well over time and can be compounded to enhance return even more.
[Note that this illustration is theoretical and does not consider the practical issues that writing daily options every day on SPY would entail. Next week, I will discuss the practical issues around writing daily covered call options on SPY or QQQ.]
Got a question or a comment?
We're here to serve IVolatility users and we welcome your questions or feedback about the option strategies discussed in this newsletter. If there is something you would like us to address, we're always open to your suggestions. Use rhlehman@ivolatility.com.
Previous issues are located under the News tab on our website.