A Correction Has Begun - Now What?
April 18, 2024
The Markets at a Glance


Trend Breaks Are Different Than In-Trend Corrections
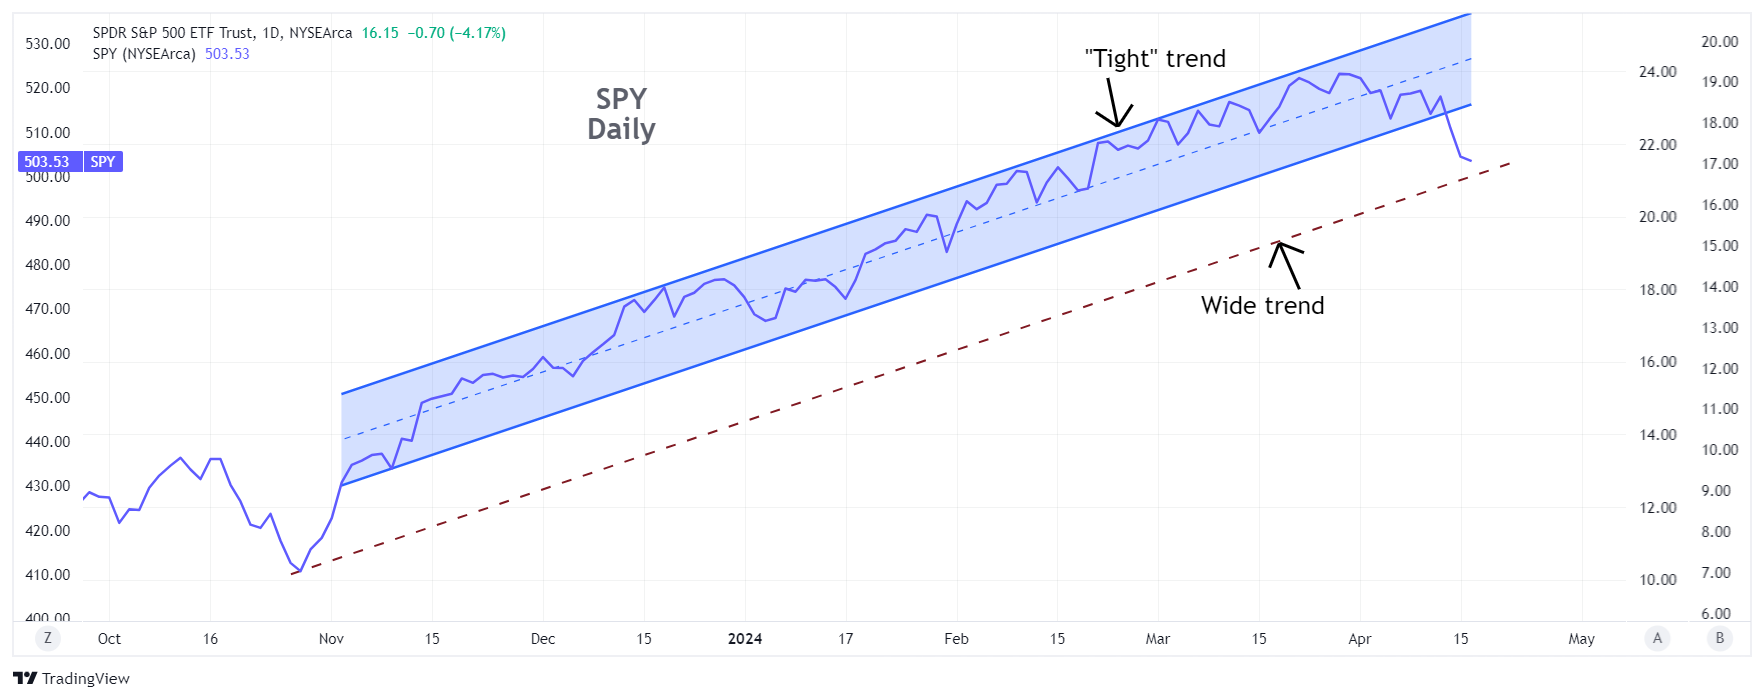
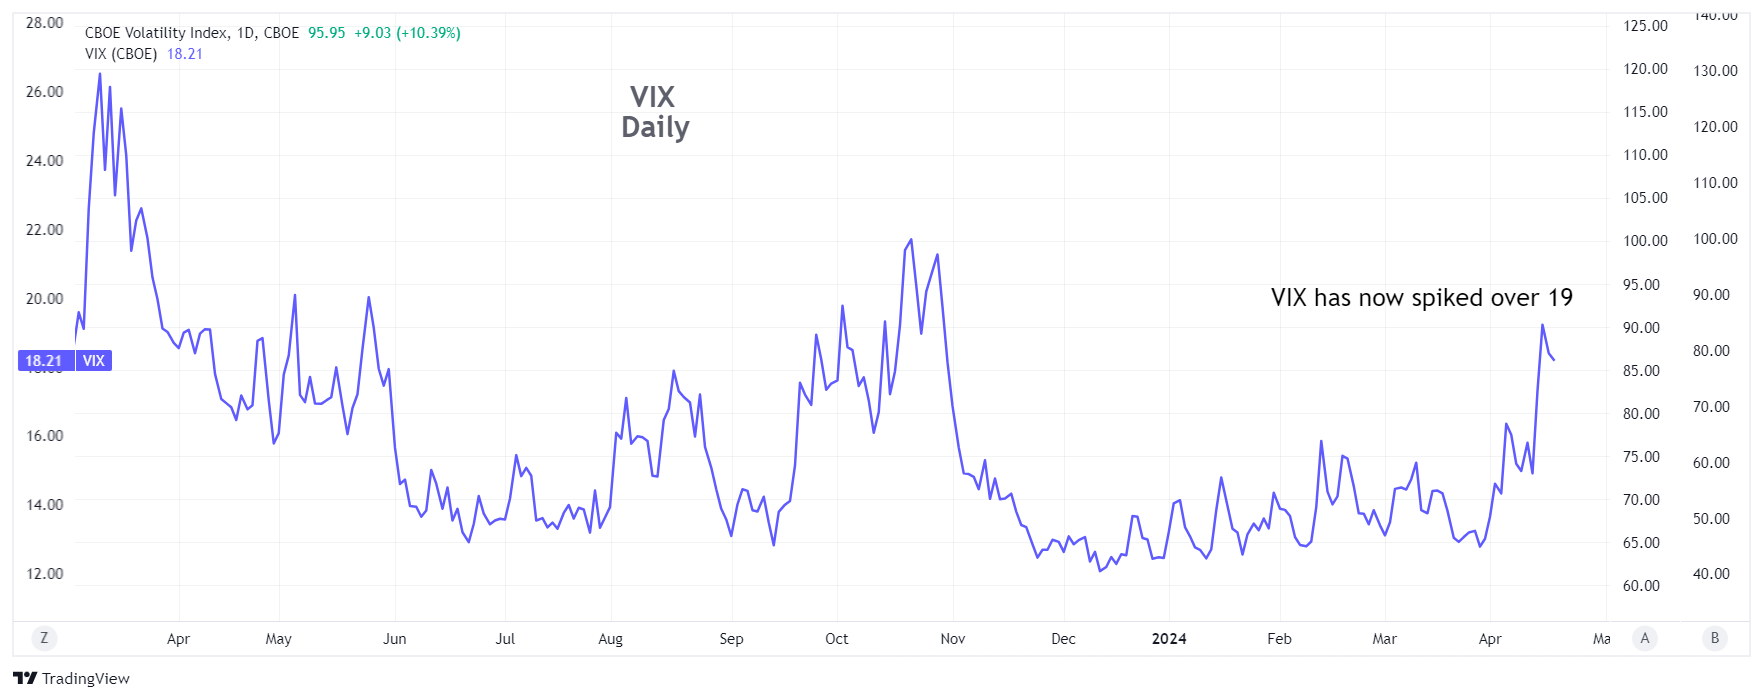
It is now clear that some sort of correction has begun. A wide trend interpretation that is drawn from the Oct '23 low has not yet broken, but is close. On the other hand, a "tight trend" interpretation drawn off all the other lows since last October was unequivocally broken. A spike in VIX above 19 suggests that the correction may well represent a trend change or major adjustment.
When the market breaks its primary uptrend, conditions can change considerably from those of the prior trend. It can be important to remember that corrections within a primary trend are different than the corrections that involve trend breaks. A correction within a multi-month uptrend will tend to have the following characteristics:
• Downside is limited to the boundaries of the uptrend, where buyers will tend to enter the market to capitalize on temporary dips. Many institutions may even have orders on the books to buy stocks when the market drops to lower trend support.
• Implied volatility remains subdued or rises only slightly, even as the market declines.
• Surprises tend to be on the upside as investors are complacent about risk and are confident when adding to positions or taking on more leverage.
In contrast, when the market breaks to a downtrend as the current primary trend:
• Downside moves can be sharp and excessive. They will now tend to be constrained to the boundaries of the new downtrend rather than the former uptrend. In the beginning of the correction, the new trend boundaries will not have been determined yet, so the angle of descent on the overall move will not be known.
• Sharp drops followed by sharp recovery bounces will happen more frequently.
• Minor rallies will occur but will fizzle out quickly, sometimes the same day, and will form consecutively lower highs.
• The absence of new positive news will tend to cause stocks to drift lower.
• Implied volatility will spike upward and remain at elevated levels.
Strategy talk: Option Strategies For Downtrends
In general, long puts can be used with greater success in declining markets than in the milder corrections that occur inside uptrends. However, higher implied volatility means long puts will be even more expensive than usual. Thus, as I mentioned in the last letter, diagonal put spreads using ITM puts about one month or more out in time for the long side and very short-term ATM or OTM puts for the short side is a good strategy to consider. (The SPY May 530 put mentioned last week at 17.30 closed this Wednesday at around 29.40. Even with short puts limiting that gain, you can see how diagonals can be a strong strategy in such market conditions.) With ETFs such as SPY and QQQ, you don't need to labor over the best stock to play on the downside and you have the advantage of expirations every day to short puts and roll them if they go ITM.
Diagonal put spreads can function as a core strategy, akin to holding covered call writes during uptrends, and other positions can be traded around that core as a correction progresses. Auxiliary positions can include:
• Credit call spreads initiated when a recovery bounce appears to be losing steam in either the market indexes or individual stocks.
• Diagonal call spreads when sharp sell-offs appear to bring stocks or ETFs down to key support levels.
• Short OTM puts on stocks you may be willing to acquire if they have a brief overreaction on the downside (or simply capture the put premium if they don't).
• Butterfly call spreads on stocks or ETFs that have experienced strong declines to play the recovery bounce, but with limited risk and time value decay.
Another point to remember is that stocks tend to become more correlated in their movements during declines than advances. That means ETFs may increase in volatility during broad corrections even more than individual stocks, as the component stocks in the ETF align together on the downside. As such, ETFs, which might offer less exciting moves in up markets than individual stocks, can offer stronger moves to the downside as their component stocks all get going in the same direction.
Got a question or a comment?
We're here to serve IVolatility users and we welcome your questions or feedback about the option strategies discussed in this newsletter. If there is something you would like us to address, we're always open to your suggestions. Use rhlehman@ivolatility.com.
Previous issues are located under the News tab on our website.