Last Week’s Highlights at IVolLive:
- Register HERE for our next live webinar on Tuesday, October 17th where we will discover How to go Back In Time With The Options Market.
- Get a free IVolLive Trial HERE.
Another Potential Opportunity with Oil...
October 13, 2023

Timing.
The timing of trades can be just as important as what is being traded in the first place. Often, the market will reward patient traders with better entry/exit points.
One good example of that is oil. After a dramatic runup during the summer, oil sold off hard in early October. Then, conflict erupted in Israel...
While it's impossible to predict geopolitics one thing is for sure: then resolution will not be easy or swift.
This means there will be multiple trading opportunities if timed correctly. Speaking of timing, let's do two things: First, we'll use our IVolLive charts as our timing compass, and second, we'll use the Sentiment Analyzer to check in on the poster child for big oil: Exxon (XOM):

How to Play It
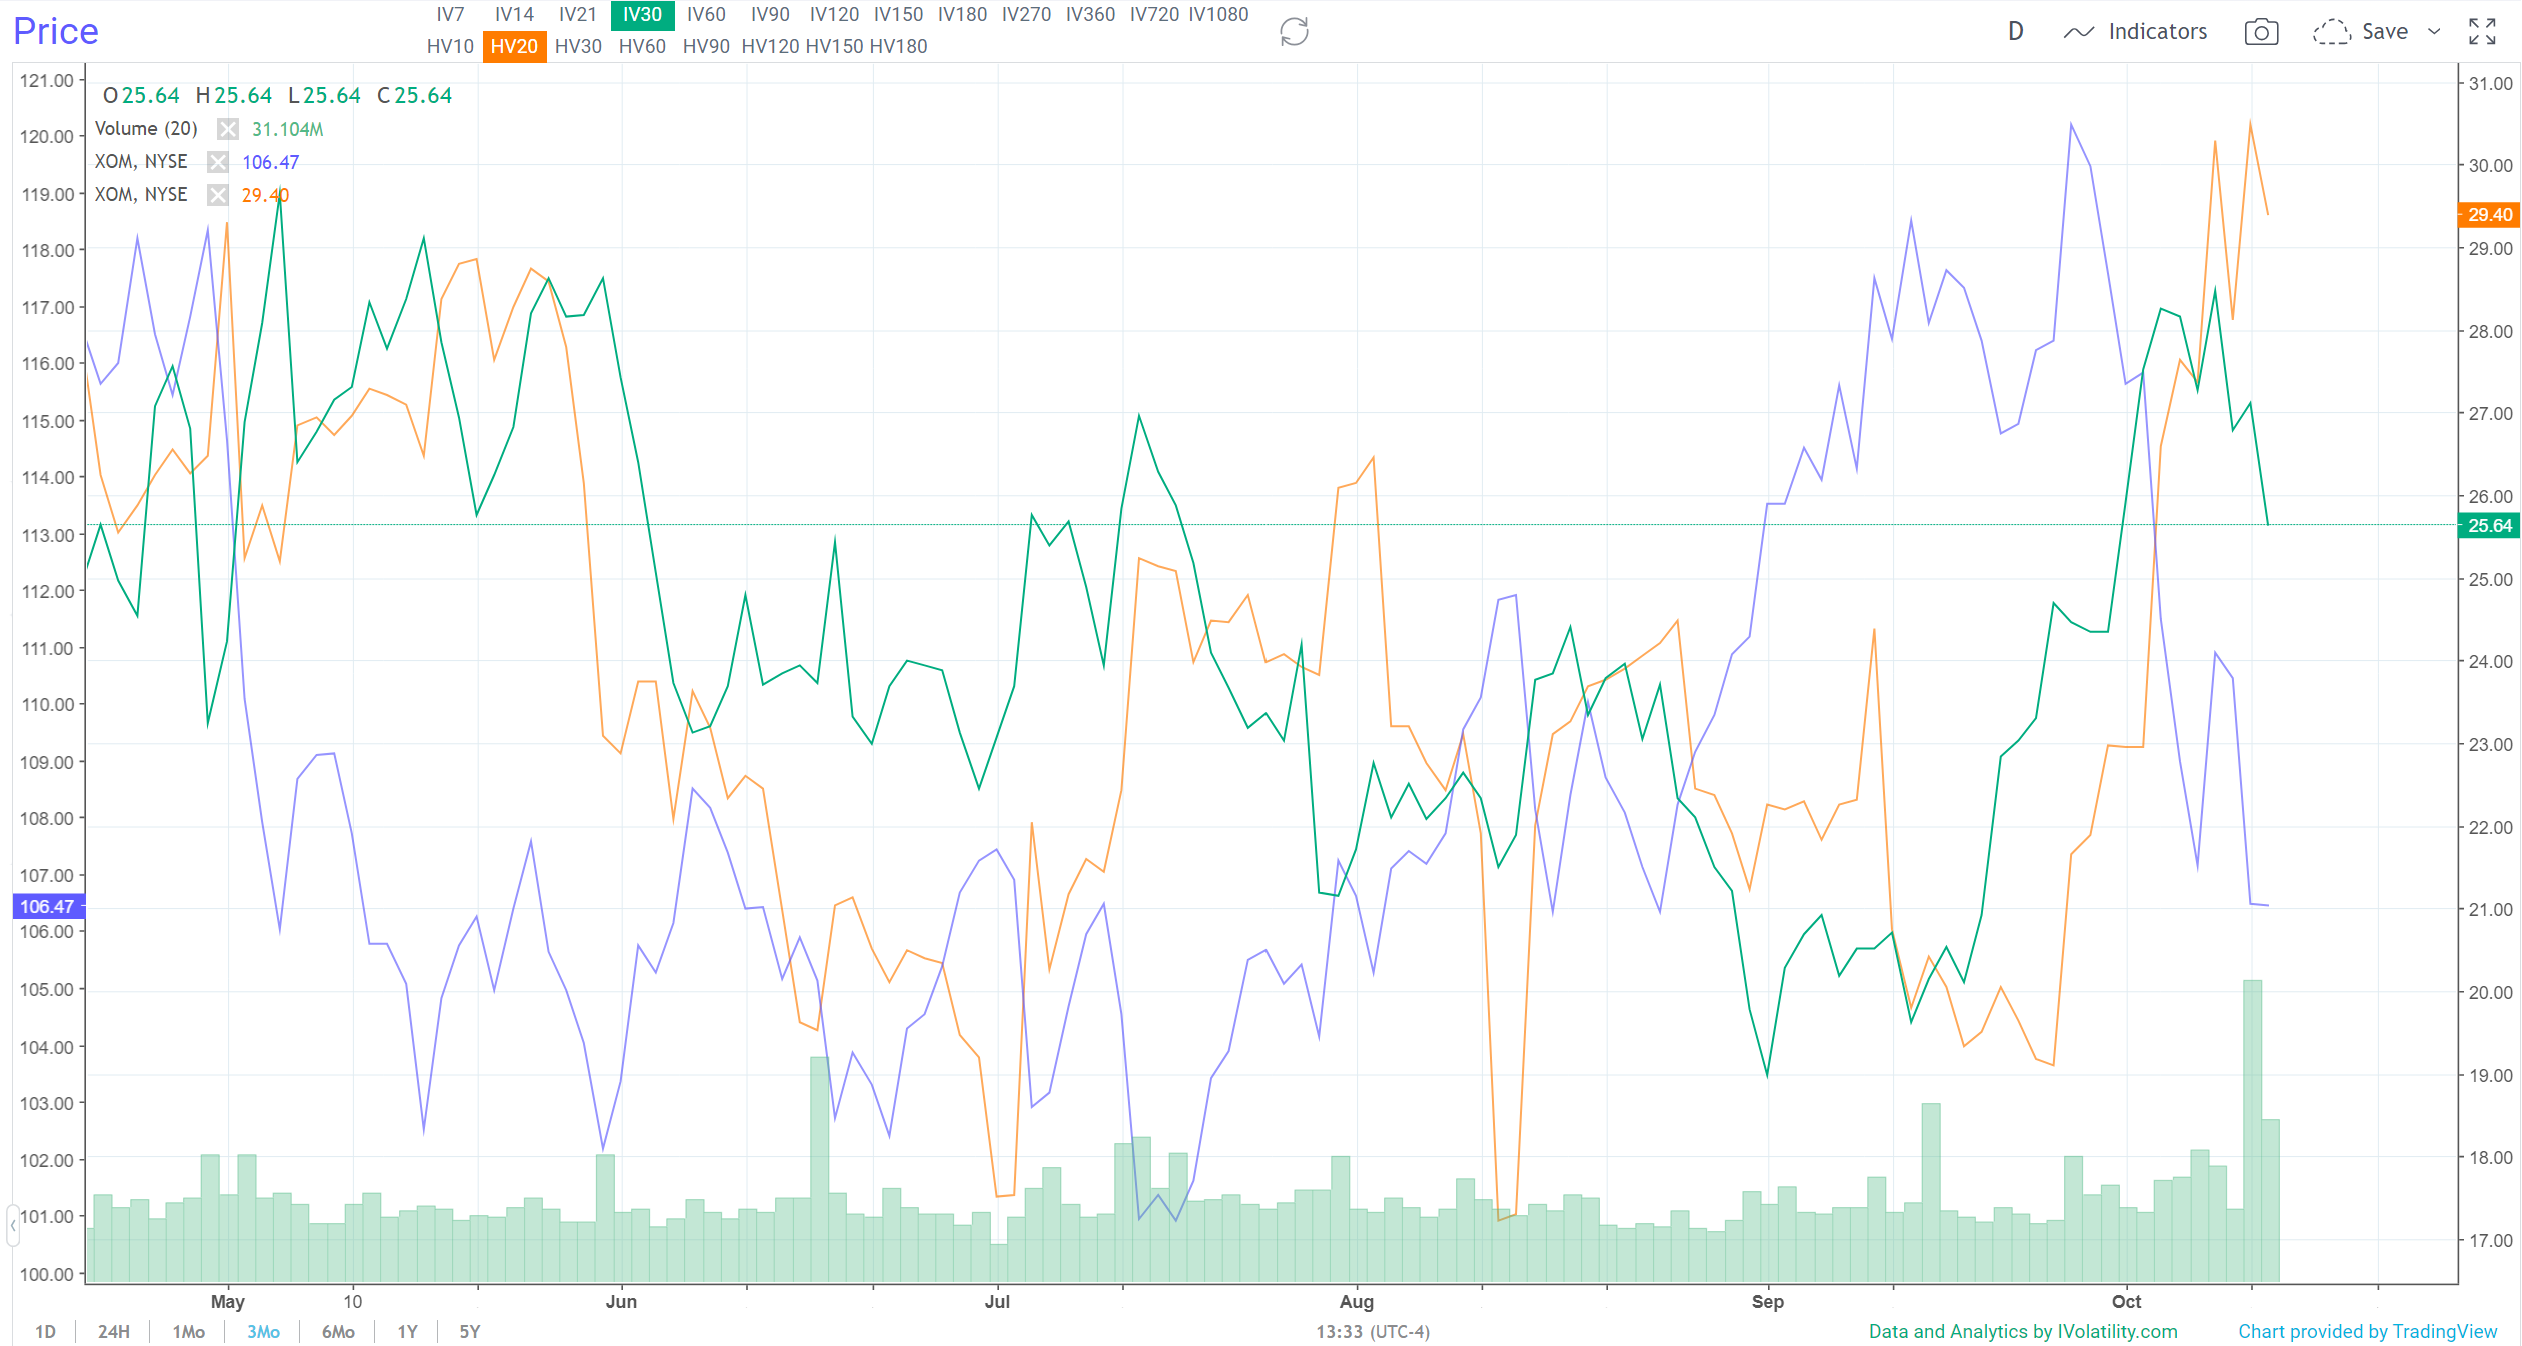
Here are the key takeaways from this three-month chart:
• Exxon's share price has bounced then retraced following the outbreak of violence.
• At the same time, Implied Volatility (green line), it is coming down. This means option premiums are also declining.
• With option premiums getting cheaper - and Exxon retracing to essentially the same price it was trading at in the beginning of October - now could be a good time to strike on a bullish bet.
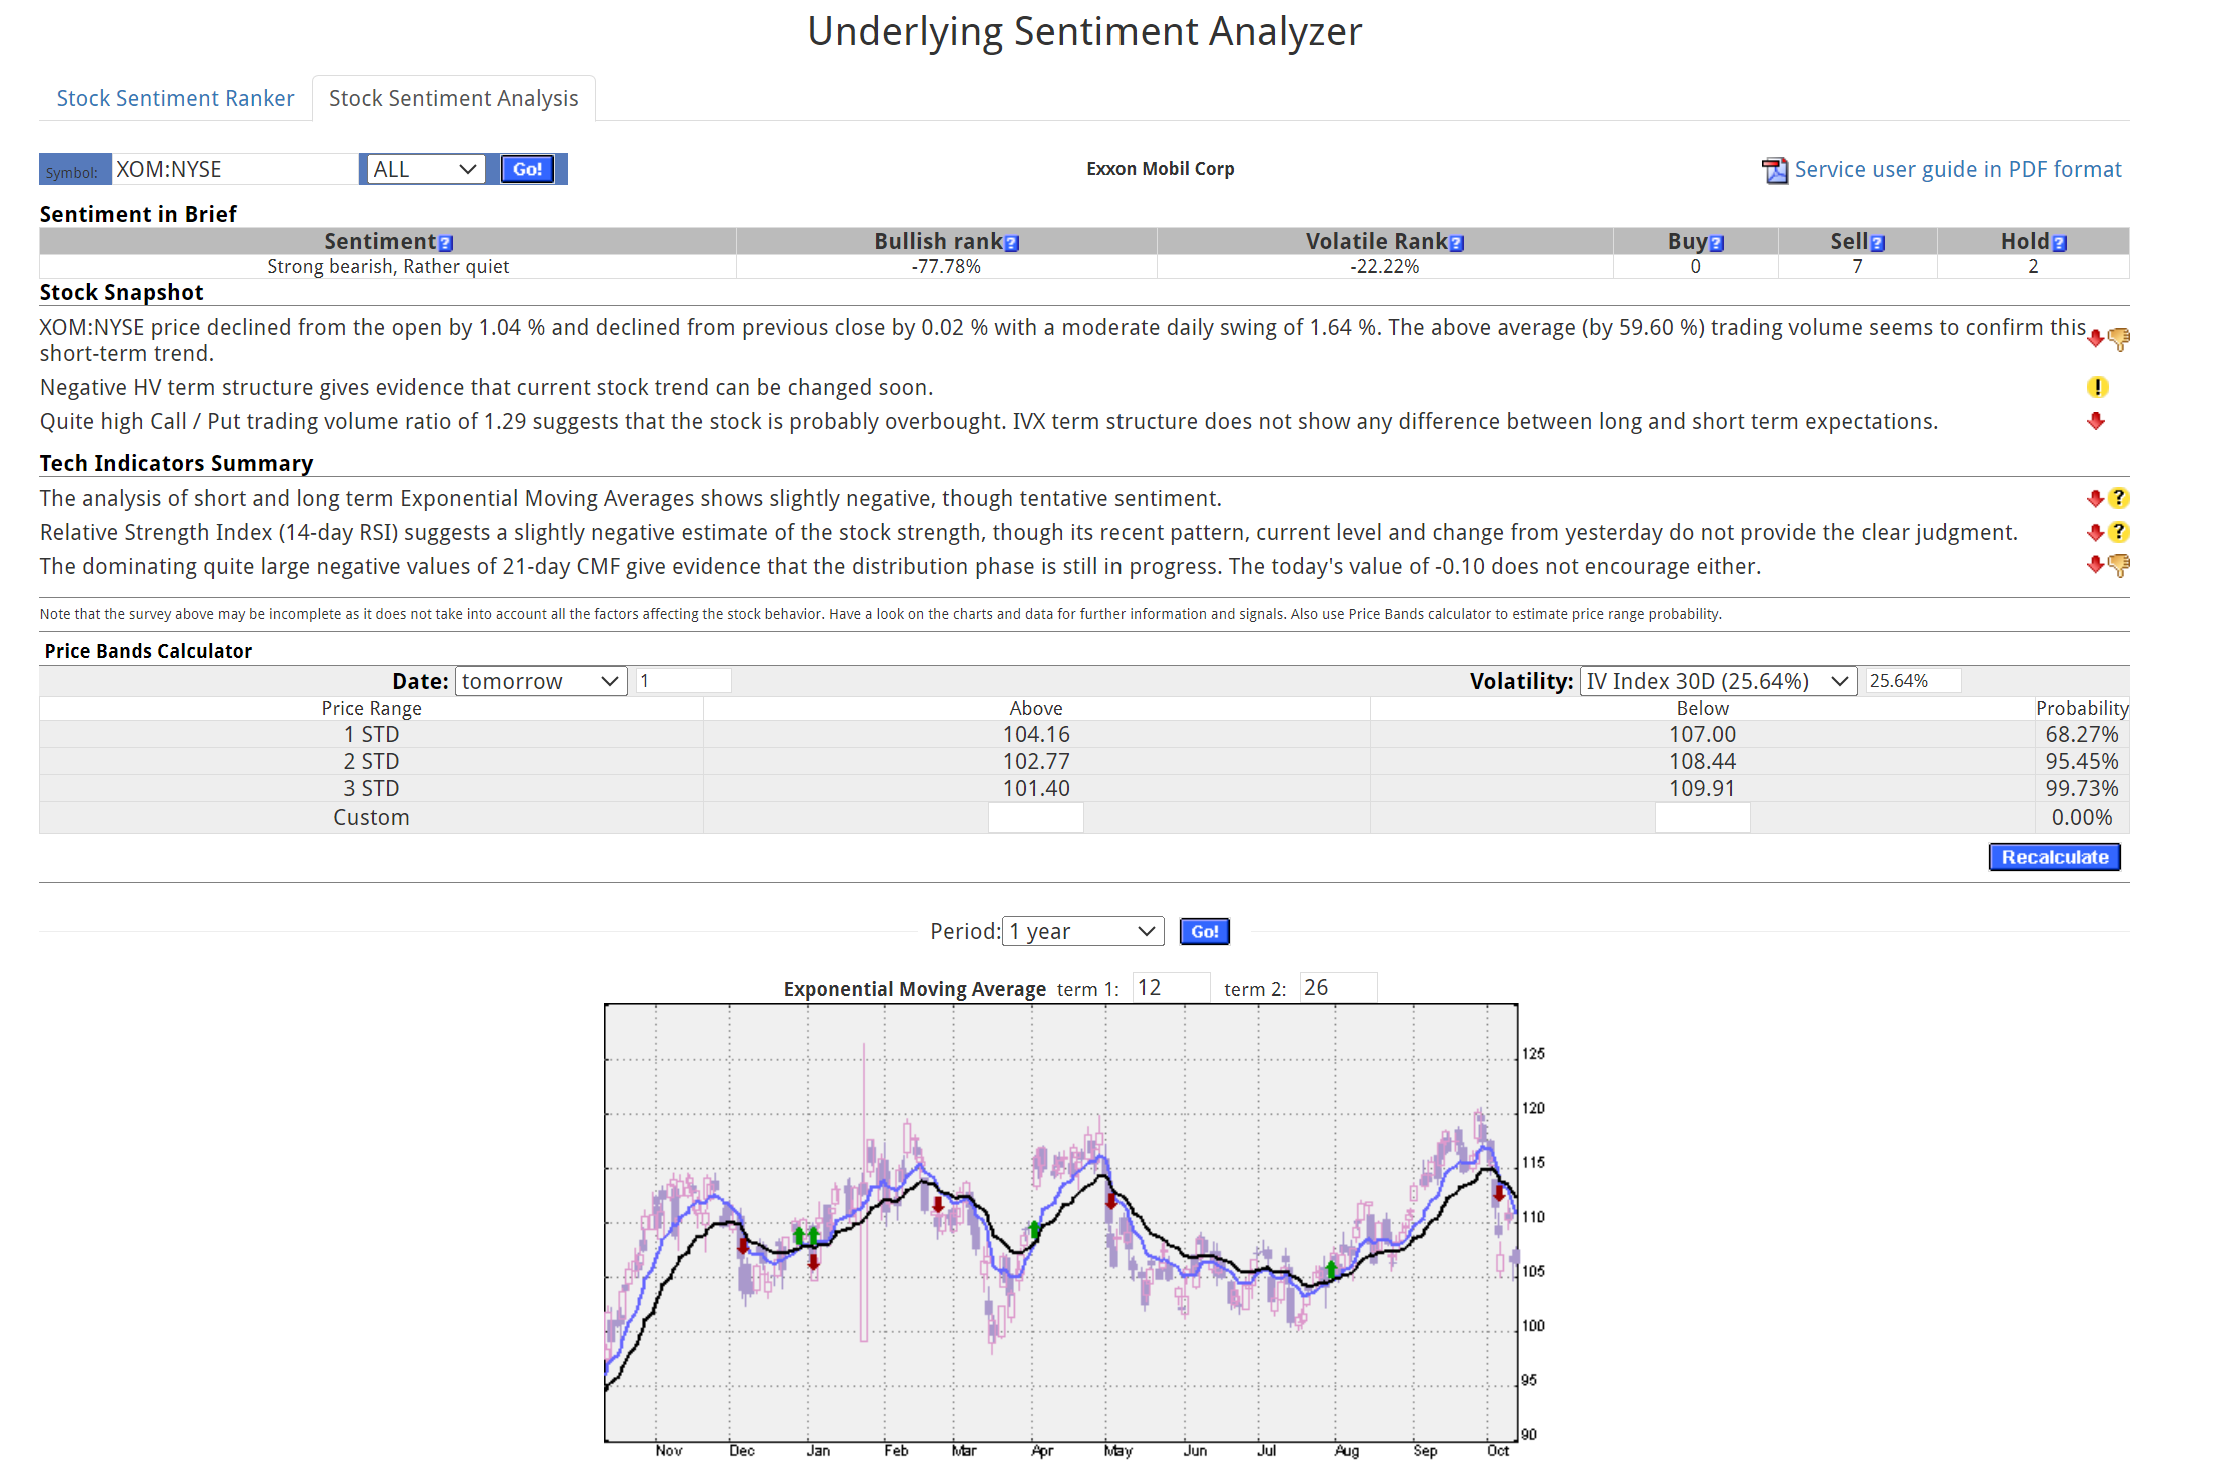
And speaking of Sentiment, let's pull up the webinar topic this week to dig deeper into Exxon's current Sentiment:

The Sentiment Analyzer tells us that Exxon is trading in a bearish formation and is rather quiet (i.e. option premiums are not inflated from overly high volatility).
This is a great example of how the Sentiment Analyzer can be a leading contrary indicator before a stock switches over from Bearish to Bullish, or vice versa.
(Watch an encore replay of Tuesday's webinar on the Sentiment Analyzer HERE).
Previous issues are located under the News tab on our website.