Last Week’s Highlights at IVolLive:
- Don't forget to register for our next live webinar on Tuesday, August 1st 2023 Webinar Topic: Charts: How to Use Implied Volatility and Pricing Charts to Time and Make Actionable Options Trades HERE
- Get a free IVolLive Trial HERE.
Tech Retraces...
July 26, 2023
What's Happening Now in the Markets
Let's begin this week's issues with pictures rather than words. Check out these charts that measure the last three months of price and volatility action for four different stocks:

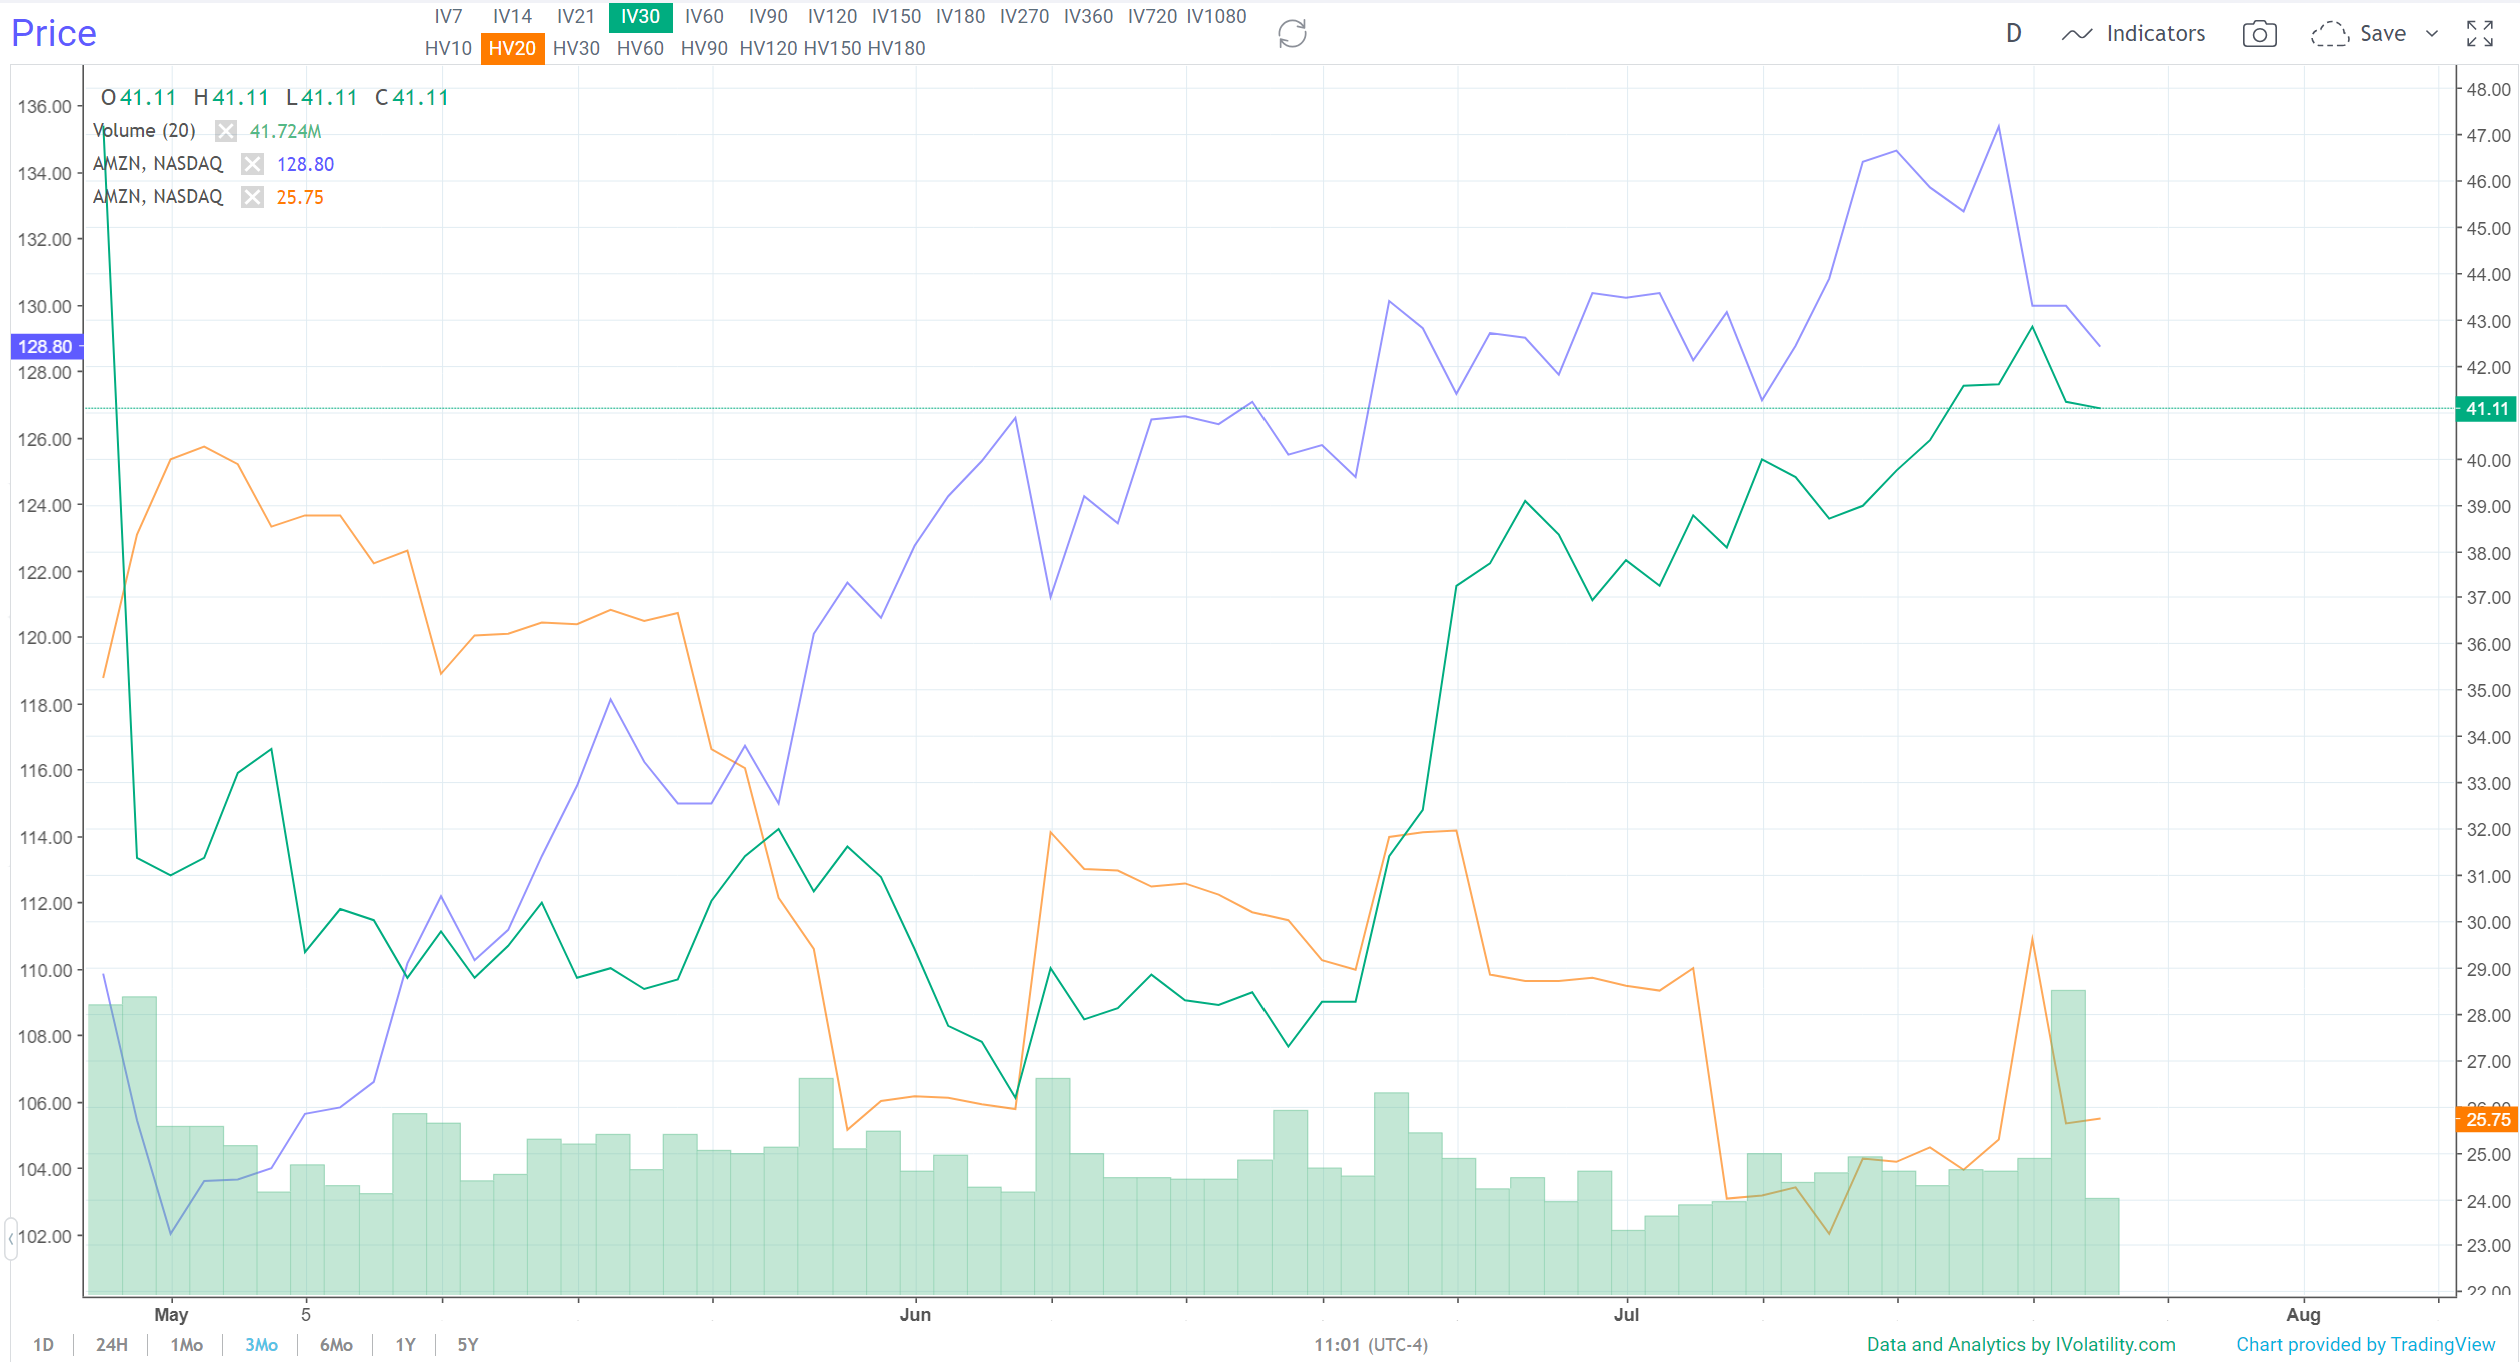
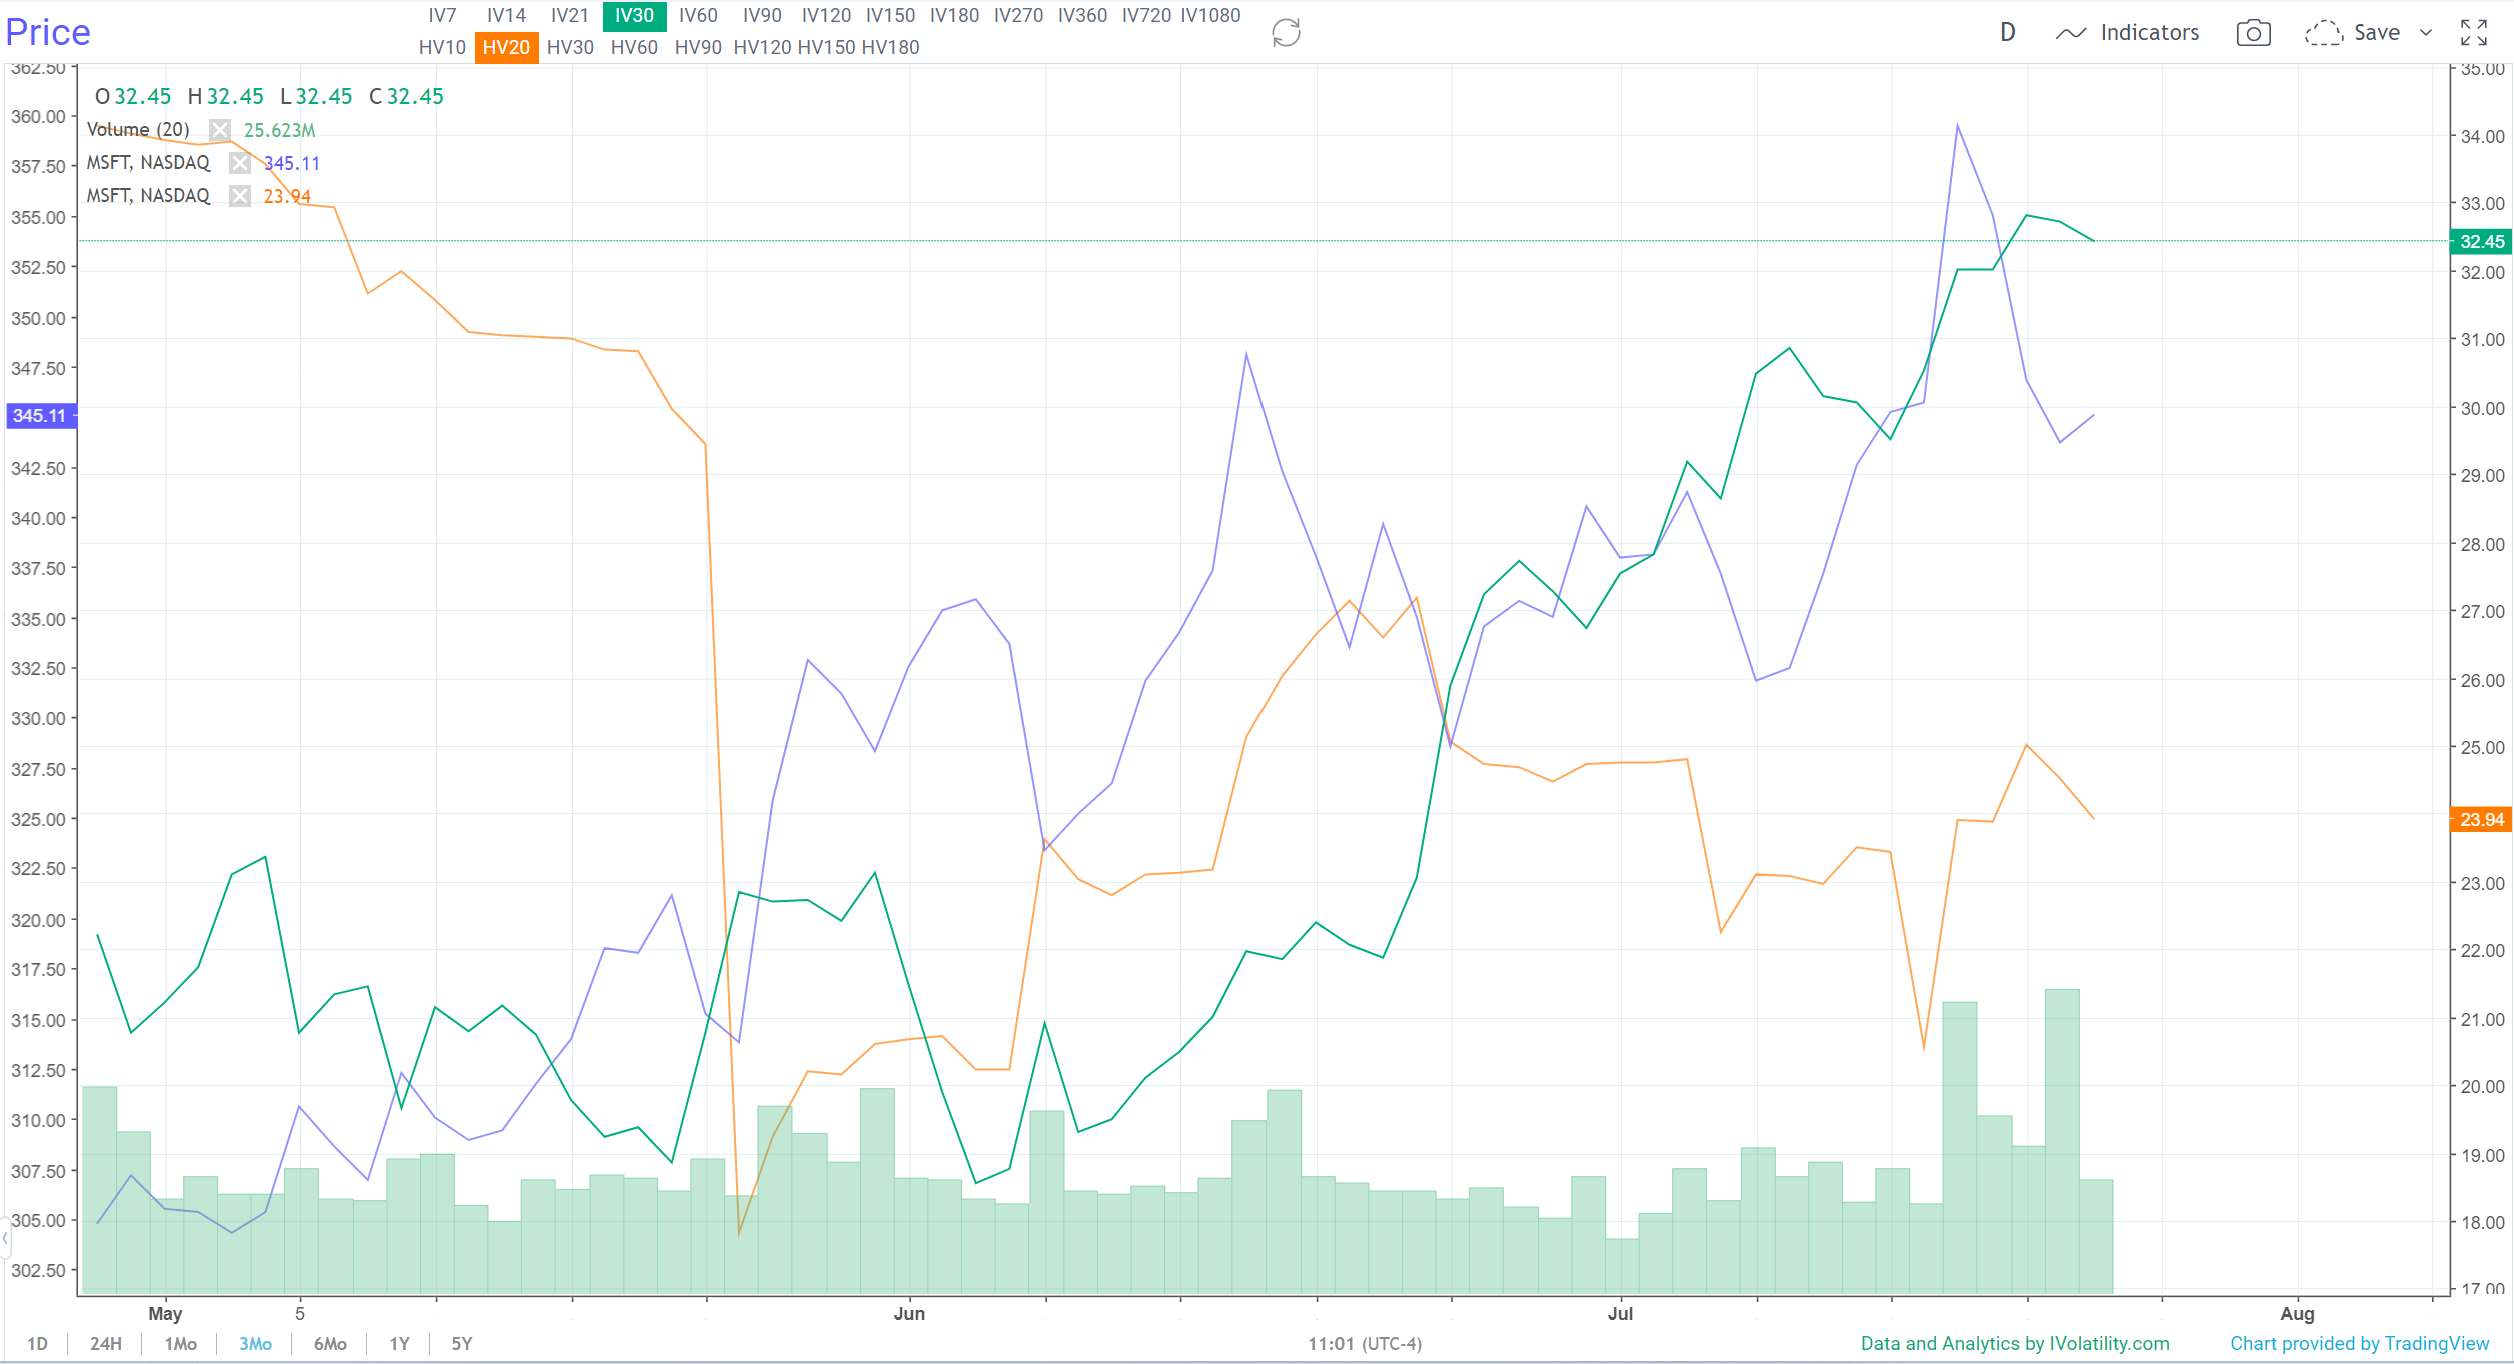
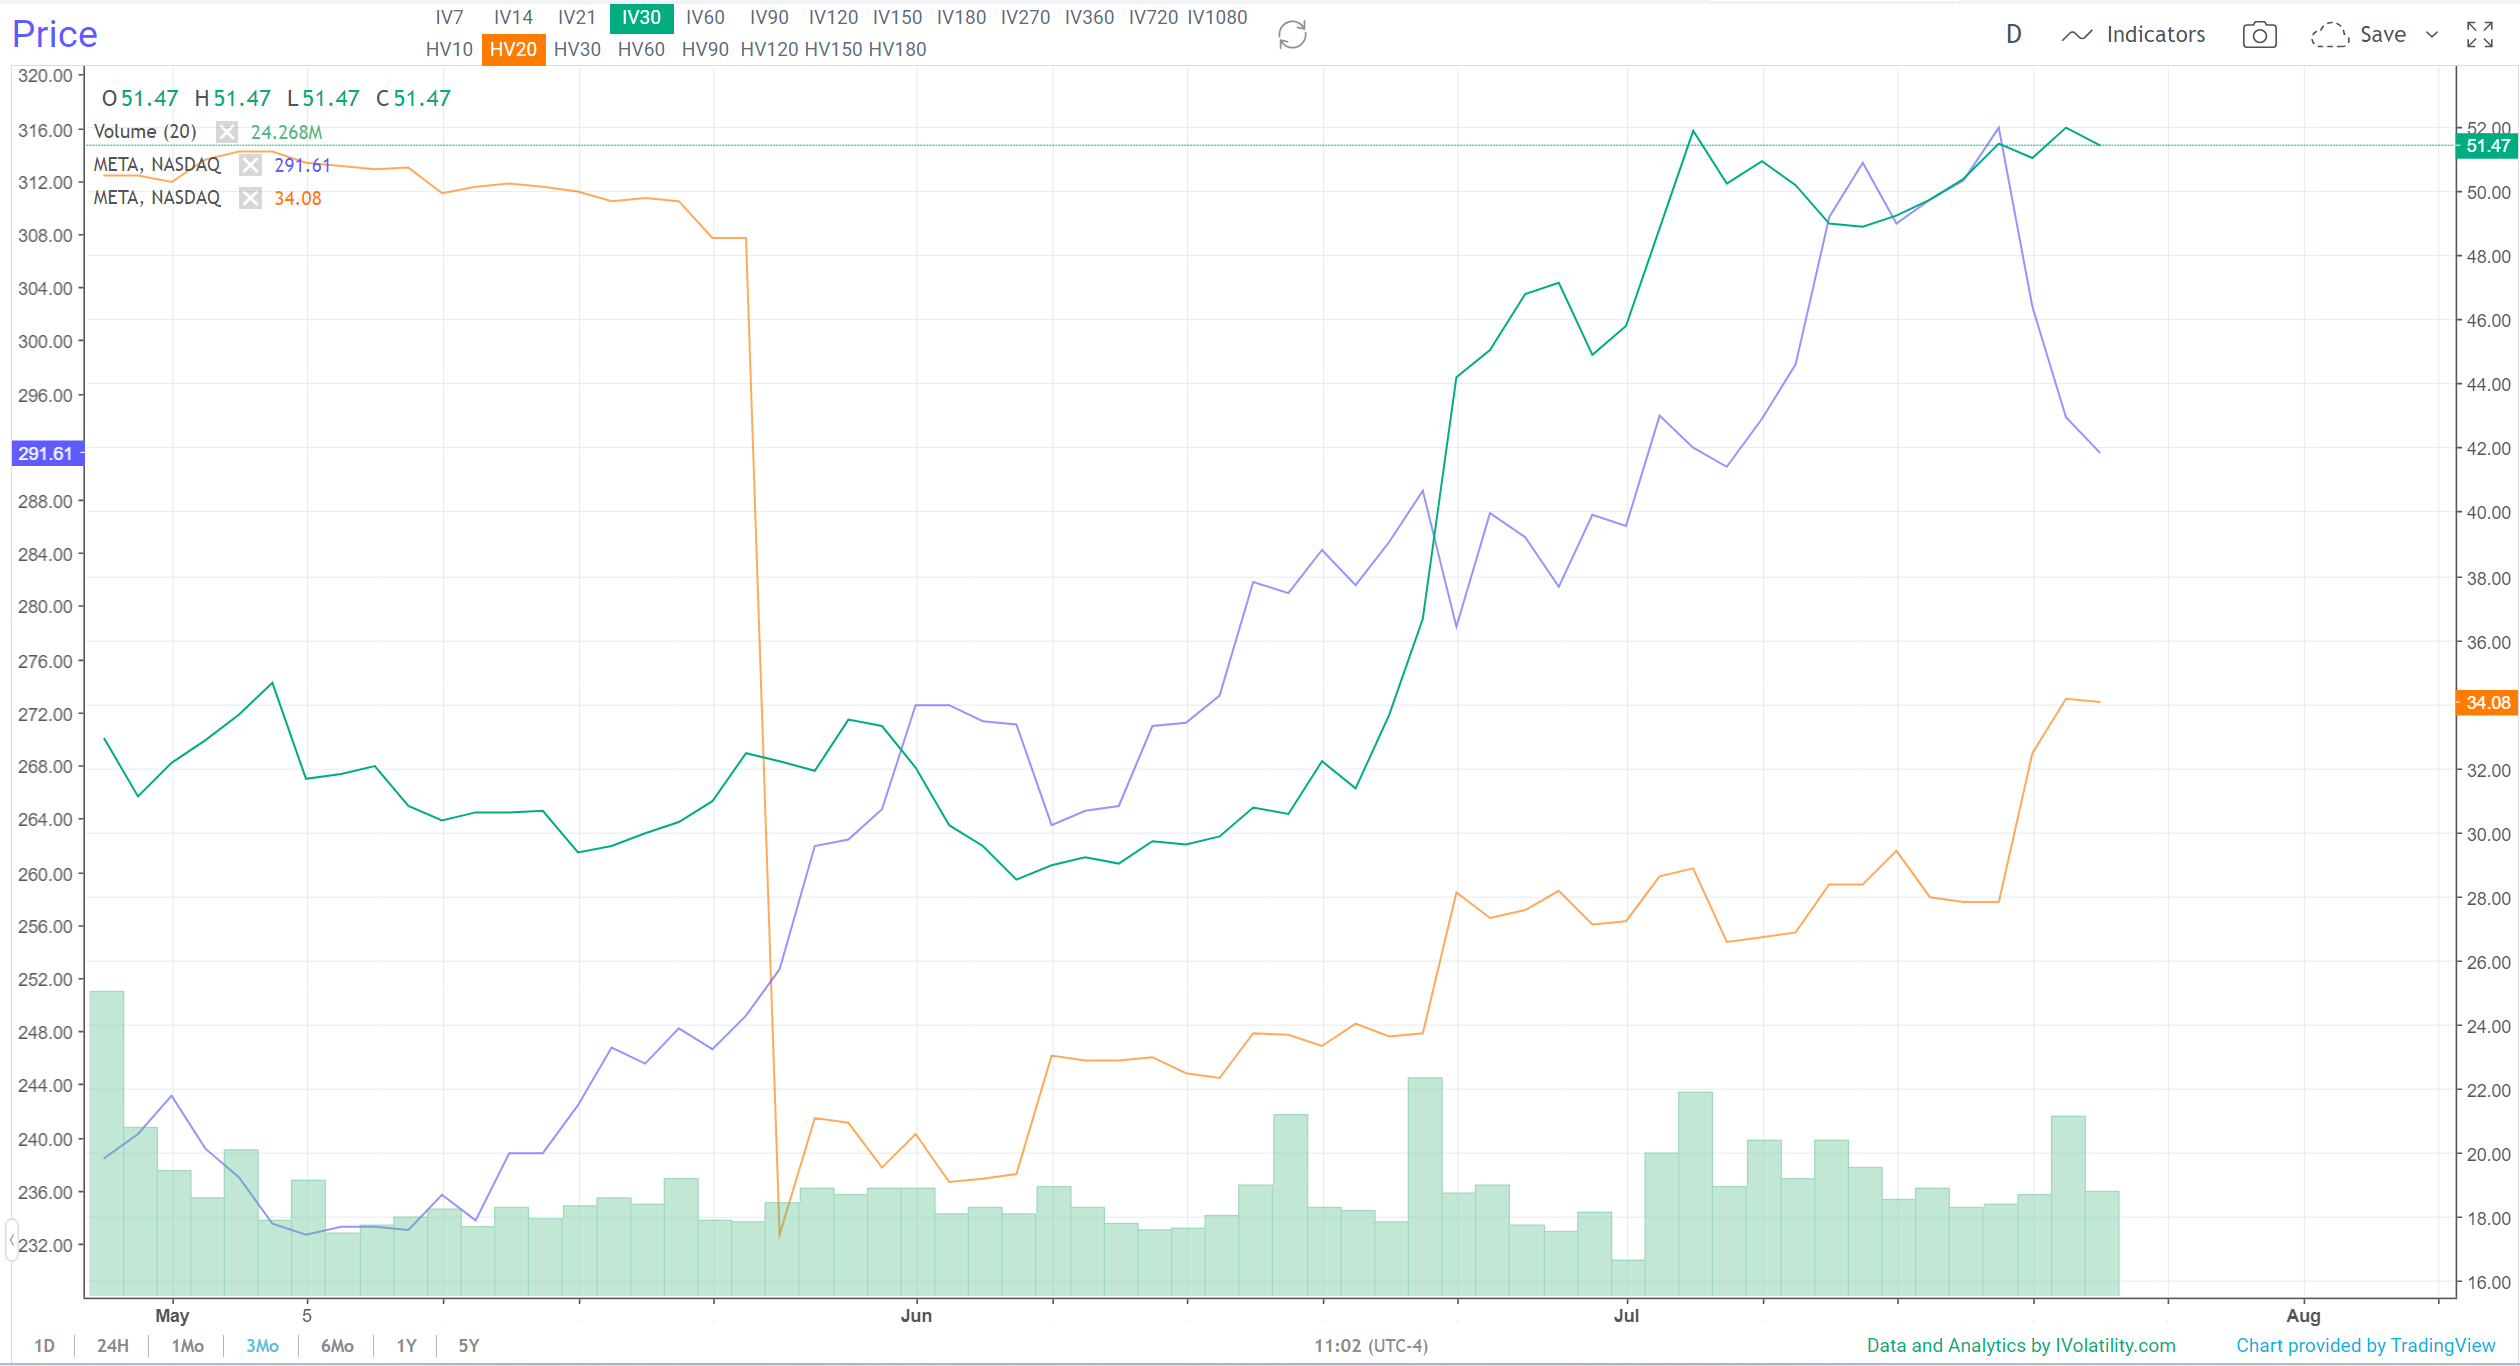
In order, these charts show the last three months of action for Apple, Amazon, Microsoft and Facebook. And you'll notice that in all three, price (the blue line) is falling lower. This means that the tech giants are finally taking a breather after racing higher at a breakneck pace for the first half of the year.
The tech giant named the AI tool "Copilot" and it used ChatGPT to answer emails, summarize meetings, and create things like PowerPoint presentations for an additional $30 per month, per user.
As traders, the key question after a retracement is: what will happen next? Will the stock bounce and resume its march upward, or will it break through support and fall lower?
Thankfully, we have Charting tools within IVolLive that help serve as a "compass" for us to use to navigate.
We can apply technical analysis to the underlying stocks' implied volatility to gauge whether a stock is likely to shoot higher or lower.
For example, let's look at Microsoft (a stock we featured in last week's edition):
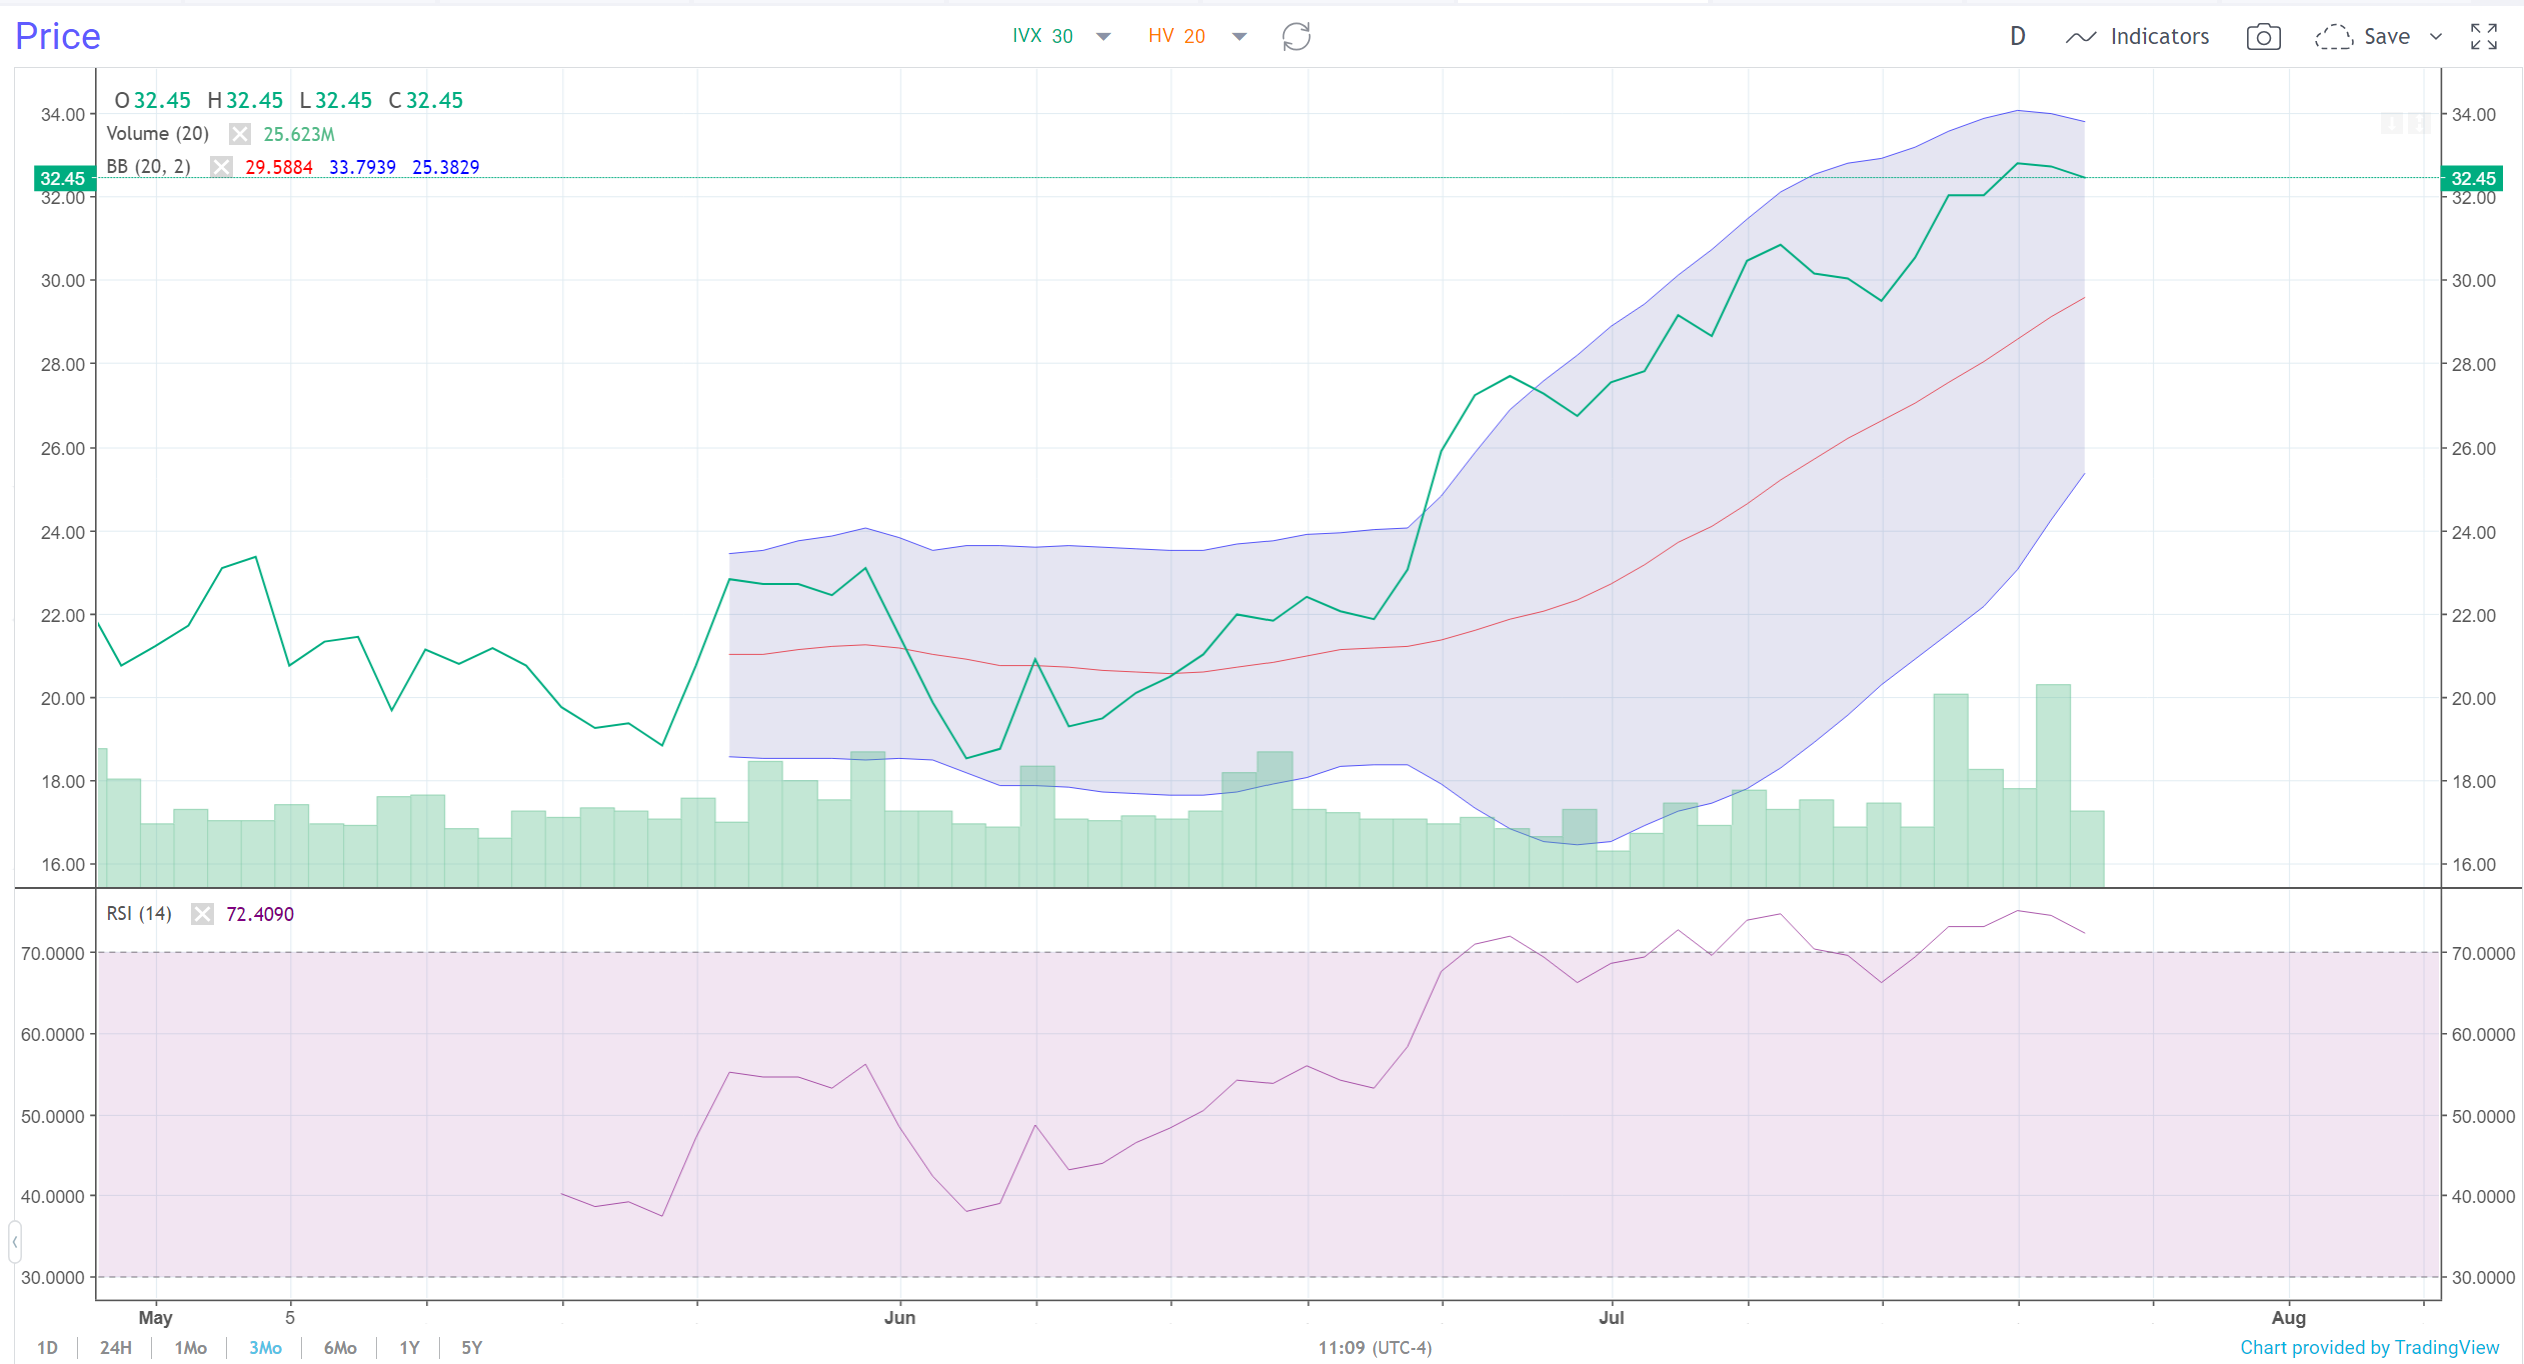
In this three-month chart, we've isolated Implied Volatility (IVX) and applied Bollinger Bands and the RSI. This chart tells us that MSFT's IVX is getting a bit overextended. An overextended IVX typically translates to a stock getting ready to bounce (the inverse relationship between volatility and price action).
Translation: MSFT is likely to bounce in the short term. Savvy options traders could look to strike with a bullish trade (outright call or bullish vertical, diagonal, or calendar spread trade).
Charting is an important part of any trader's arsenal. And as you can see, the IVolLive tools are powerful indeed. Join us next Tuesday as we take a deep dive into the IVolLive charts by registering for our webinar HERE.
How to Play It
Tech was the undisputed leader in the first half of the year. Now, big tech is taking a well-deserved breather.
Savvy traders should monitor price and IVX for signs of either (a) a rebound; or (b) a continued downward move.
Previous issues are located under the News tab on our website.