Last Week’s Highlights at IVolLive:
- On Tuesday, our IVolLive experts gave an extensive walkthrough on how to use our powerful Sentiment Analyzer to evaluate specific stocks and to run screens to find new trades. Watch the video HERE.
- On Saturday, our experts gave a LIVE walkthrough and demo on the IVolLive platform, including how to add features like stocks, charts, the Stock Monitor, and the Profit and Loss Calculator. Watch the video HERE.
- You can register for any of our upcoming LIVE webinars HERE.
- You can watch and view any of our past videos on our YouTube channel HERE.
- Register for a free IVolLive Trial HERE.
Bulls Prevail
January 30, 2023
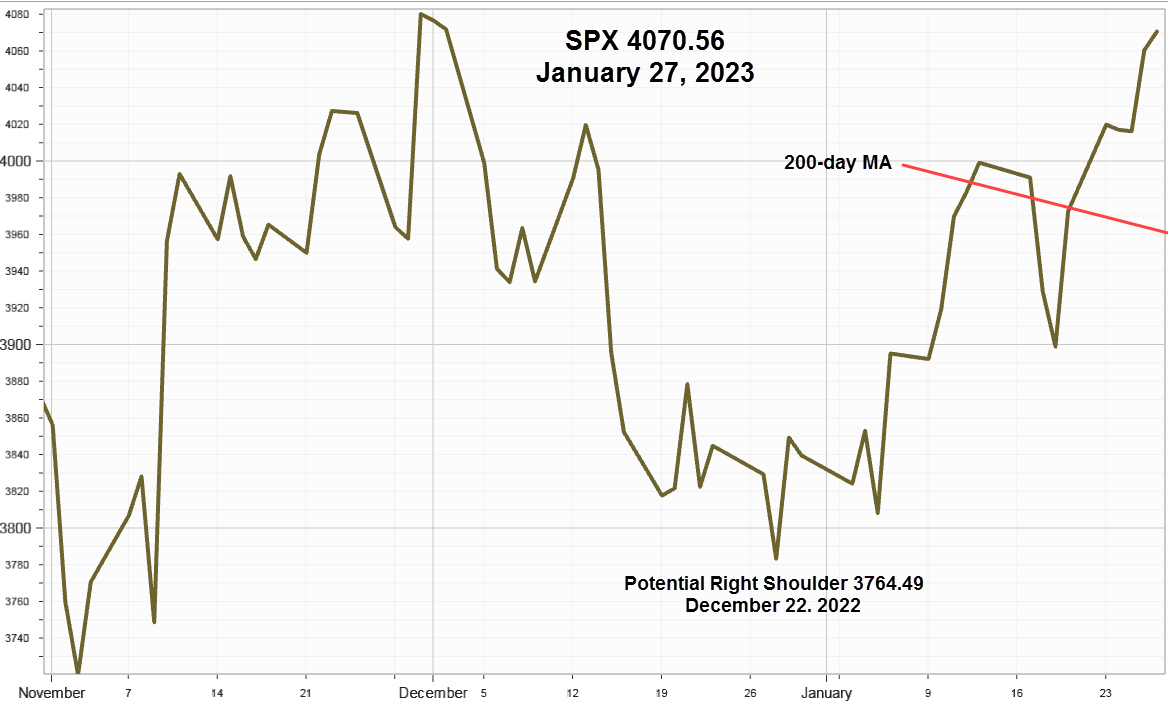
Despite an upcoming FOMC meeting - accompanied by Jay Powell's comments on Wednesday—along with Round 3 of big cap earnings reports starting this week, the bulls decided they would wait no longer as they pushed the S&P 500 Index convincingly above the 200-day Moving Average in an effort to turn the long-term trend higher.
S&P 500 Index (SPX) 4070.56 gained 97.95 points, or +2.47%, last week starting on Monday as it closed solidly above the 200-day Moving Average, as well as 4016 - the measuring objective (MO) from the range that began on December 16, pushed up like a moth drawn to a flame. This time, on the sixth attempt (see Earnings Challenge), it broke through into the sunlight and appears headed higher - boosted by a potential Head & Shoulders Bottom pattern. However, the market first needs to survive Jay Powell's comments on Wednesday afternoon, an employment report on Friday, and this week’s earnings reports and commentary from many widely held and actively traded large cap favorites.

Well, announced lowered estimates help companies beat the numbers when reporting, but those that fail to meet the numbers will likely see their stock prices drop, unless offset by positive, credible forward guidance. In addition, comments made on conference calls seem increasingly important. Then, odds for price reversals increase for those advancing before reporting as some big cap tech stocks did last week.
Implied Volatility
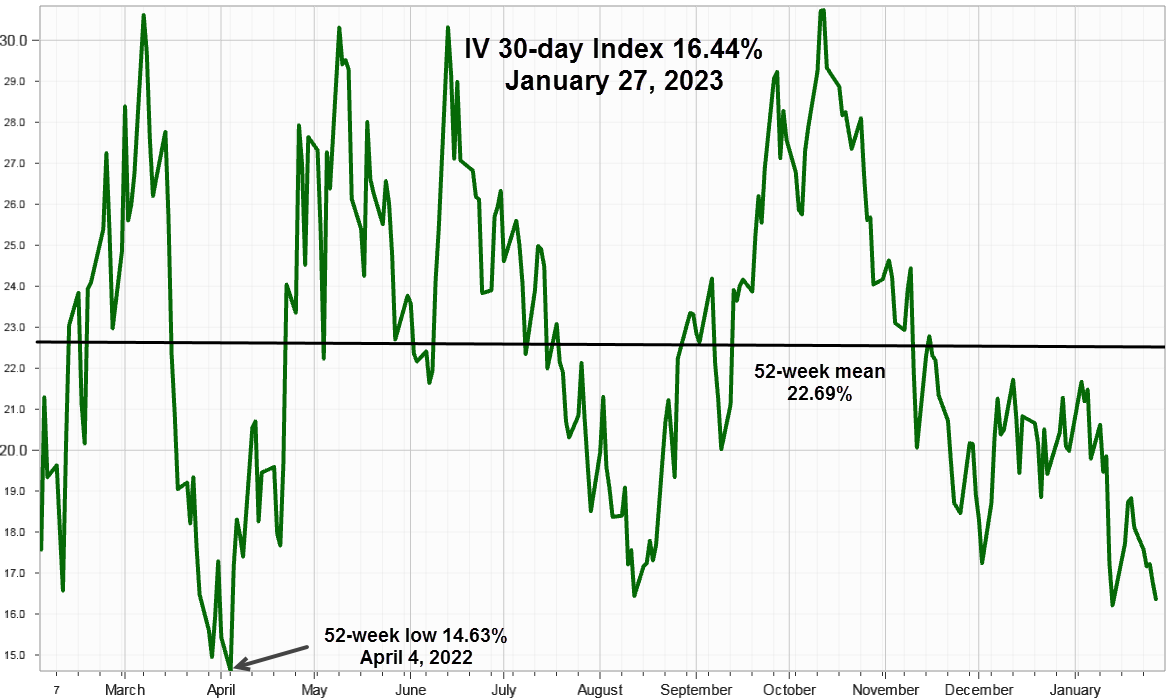
SPX 30-day options implied volatility index, IVX slipped 1.76 points to end at 16.44% while the 7-day IVX gained 5.13 points, ending at 20.75% and reflecting increased short-term option strategies along with hedging this week's three big events. Since it eventually reverts to the mean, the 52-week chart shows it at 22.69%, along with the April 4, low at 14.63%.

Market Breadth as measured by our preferred gauge, the NYSE ratio adjusted Summation Index that considers the number of issues traded, and reported by McClellan Financial Publications continues on an upward guide path adding another 269.84 points to end the week at 885.30
Invesco S& P 500 Equal Weight ETF (RSP) 150.80 up 3.34 points last week adds further support to the bullish breadth view having closed above the January 26, high at 150.52.
Summing Up
Having now convincingly closed above the downward sloping 200-day Moving Average, as well as the downward sloping trendline from last January's high, the S&P 500 Index supported by favorable breadth and low option implied volatility, appears headed higher. However, Jay Powell's comments, earnings reporting, and the employment data on Friday need to cooperate.
Previous issues are located under the News tab on our website.