Resistance Prevailed
December 12, 2022
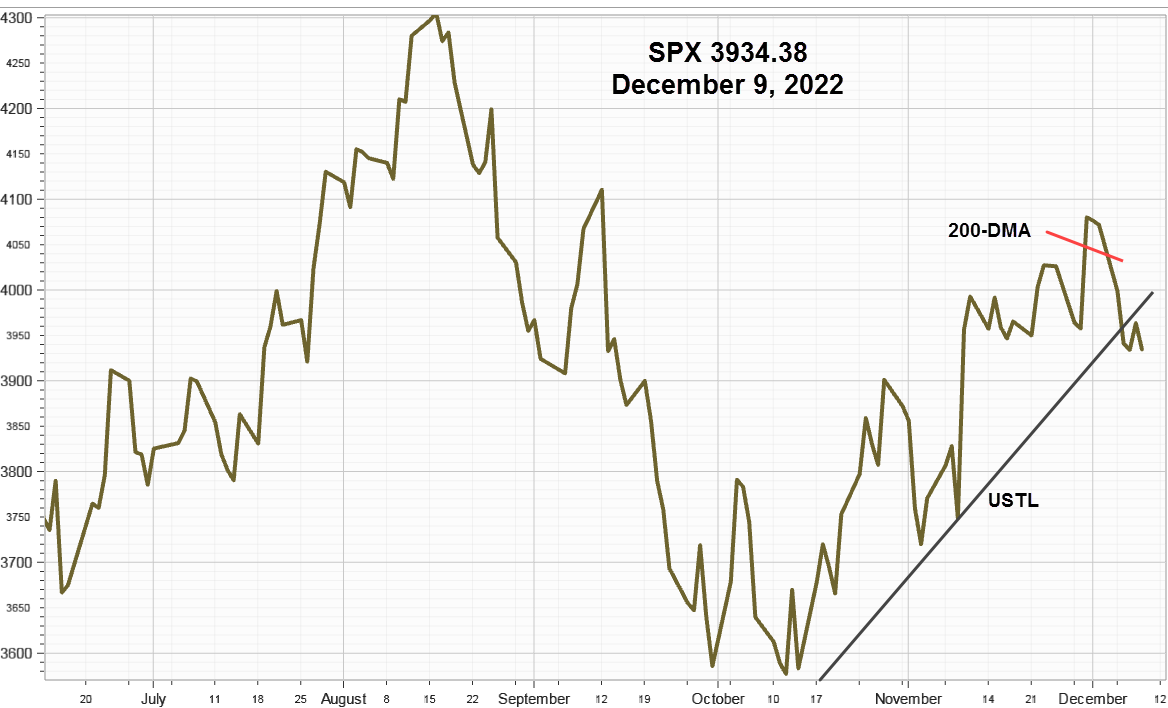
On Wednesday November 30, after Federal Reserve Chairman Jerome Powell confirmed market expectations that the Fed will likely slow the pace of Fed funds rate increases to 50 basis points (bps) on December 14, the S&P 500 Index closed above the ominous 200-day Moving Average on breakout volume. However, by last Monday it closed back below this closely watched level, and then the next day continued lower to close below the operative upward sloping trendline (USTL) that began from the October 13 low at 3491.58 as the bears took charge.
S&P 500 Index (SPX) 3934.38 declined 137.32 points or -3.37% last week with most of the decline occurring on Monday and Tuesday. The line on close chart estimates the October 13 origin at 3491.58 where the USTL originated along with the 200-day Moving Average (red line) and the subsequent December 5 lower close.

Although this week starts tilted in favor of the bears, the outcome depends on how the markets react to the Consumer Price Index data on Tuesday followed by the last FOMC meeting of the year that will include a Summary of Economic Projections and Powell's commentary.
While the options volume increased Tuesday to 3.1 million contracts by Friday, it declined to around 2.53 million although the Implied Volatility Index increased 19.21% to 20.73 with near term option implied volatility increasing faster reflecting increased hedging activity before next week's two big macro events.
Implied Volatility Spread
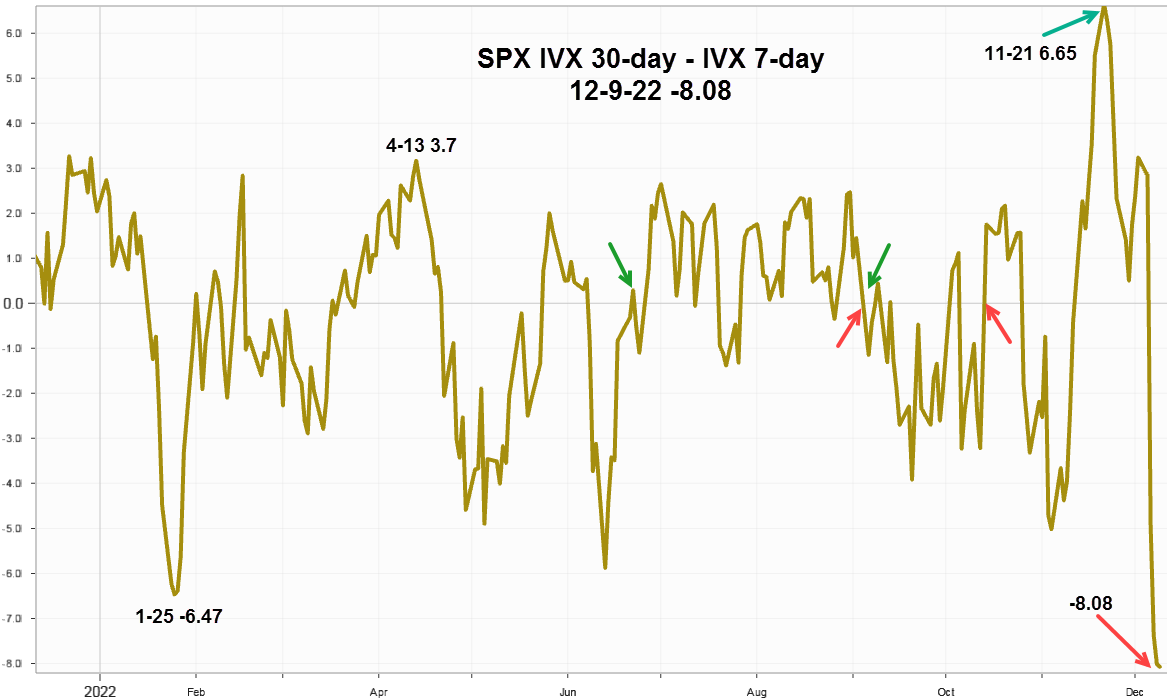
Interestingly, the spread between the standard 30-day implied volatility and the near-term 7-day option implied volatility declined to the lowest level in the last year shown as a negative value in the chart below.

Observations: January 25 with the spread at -6.47 SPX closed below the 200-day Moving Average. April 13 at 3.7 SPX closed again below the 200-day Moving Average and then the spread declined rapidly into negative territory as SPX headed lower.
When SPX trends upward, the spread fluctuates in a positive range between 2 and 3 marked with green arrows. Alternatively, when trending lower the spread turns negative in a zone between -3 and -5 see the red arrows.
It reached an extreme high positive value of 6.65 on November 21, at the start of the low volume short Thanksgiving week.
While both advanced from low levels reached on December 2, the short-term increased faster. Currently at -8.08, the spread will like increase even more on Monday ahead of Tuesday's CPI report and Powell's comments the next day. While many traders will dismiss it as trivia the ability to quantify how much option buyers are willing to pay up for hedging events could be useful for volatility traders who expect implied volatility will likely decline rapidly after Wednesday.
Summing Up
The S&P 500 Index closed above its 200-day Moving Average then quickly reversed and turned lower again to close below the operative upward sloping trendline from the October 13 origin at 3491.58 as upside resistance prevailed.
Although Powell confirmed the Fed will only increase the Funds rate by another 50 basis points at the FOMC meeting on Wednesday some analysts claim markets still need to adjust rate expectations higher-for-longer. Others claim more rate increases at the short-end of the curve will break something and force the Fed to pivot by the middle of next year. Release of the Consumer Price Index on Tuesday morning could swing the narrative one way or the other.
As for the much-ballyhooed year-end Santa Claus rally, remember December 2018, another time when rates were rising and equities declined. The answer for this year could come as soon as Wednesday afternoon.