CPI Short Covering
November 14, 2022
Last Thursday's slightly less than expected Consumer Price Index report at 7.7% year-over-year, means the odds increased that the December rate hike will only be 50 basis points (bps) not 75 as previously expected, based not only on this one data point but also because it hopefully represents a turning point. Fed Funds futures dropped from 5.10% to 4.85% and the 2-Year Treasury Note declined 27 bps to end at 4.34%. Equities rocketed higher as if ignited after being lilt by a fuse.
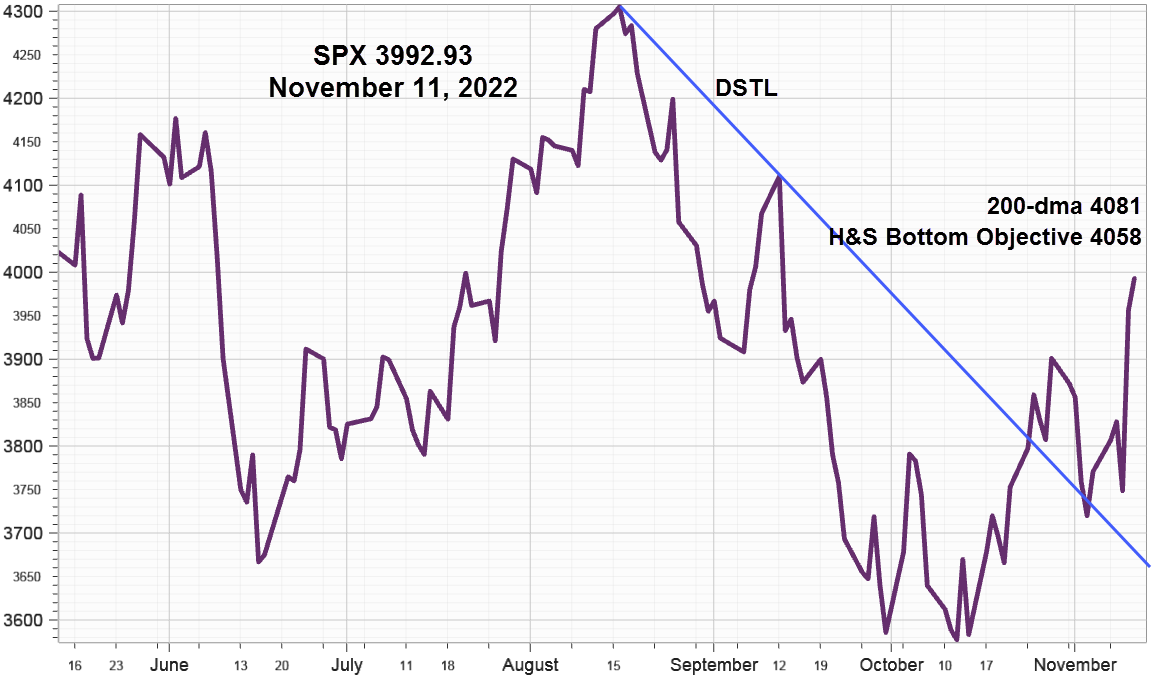
S&P 500 Index (SPX) 3992.93 roared up 222.38 points or +5.90% with 207.80 points or 5.54% of the gain occurring on Thursday after opening gap higher following the CPI report. Then it accelerated above the 50-day Moving Average, well clear of the downward sloping trendline (DSTL) from the August 16 high at 4325.28 (blue line) and headed for the upside measuring objective at 4058 of the small Head & Shoulder Bottom pattern described in Great Expectations, now just below the 200-day Moving Average (200-dma below) at 4081 where it will likely encounter considerable resistance.

Although Thursday's opening gap along with the 5.54% gain on the day looks like impulsive short covering, momentum will likely prevail until it reaches the 200-day Moving Average and the downward sloping trendline from the January high at 4818.62. Then expect the bears to awaken and get busy once again.
Implied Volatility
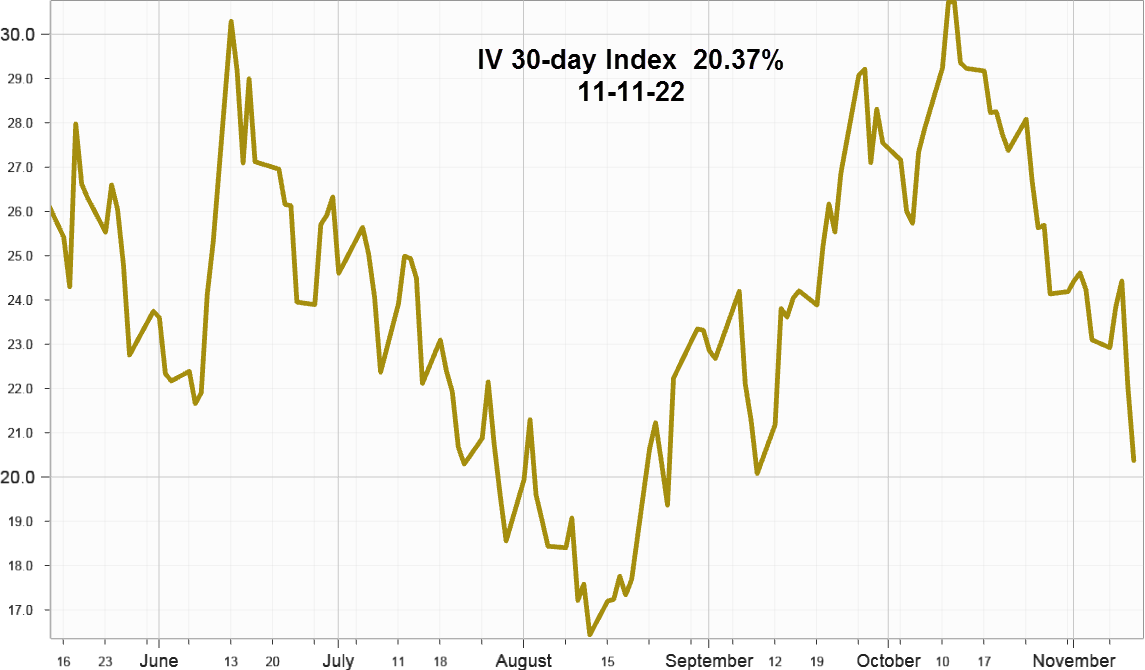
SPX 30-day options implied volatility index, IVX declined 2.73% last week to end at 20.37% dropping quickly after Thursday's CPI report as this colorful chart shows. As the SPX approaches the 200-day Moving Average implied volatility will likely increase while SPX attempts to end the current downtrend that began in January.

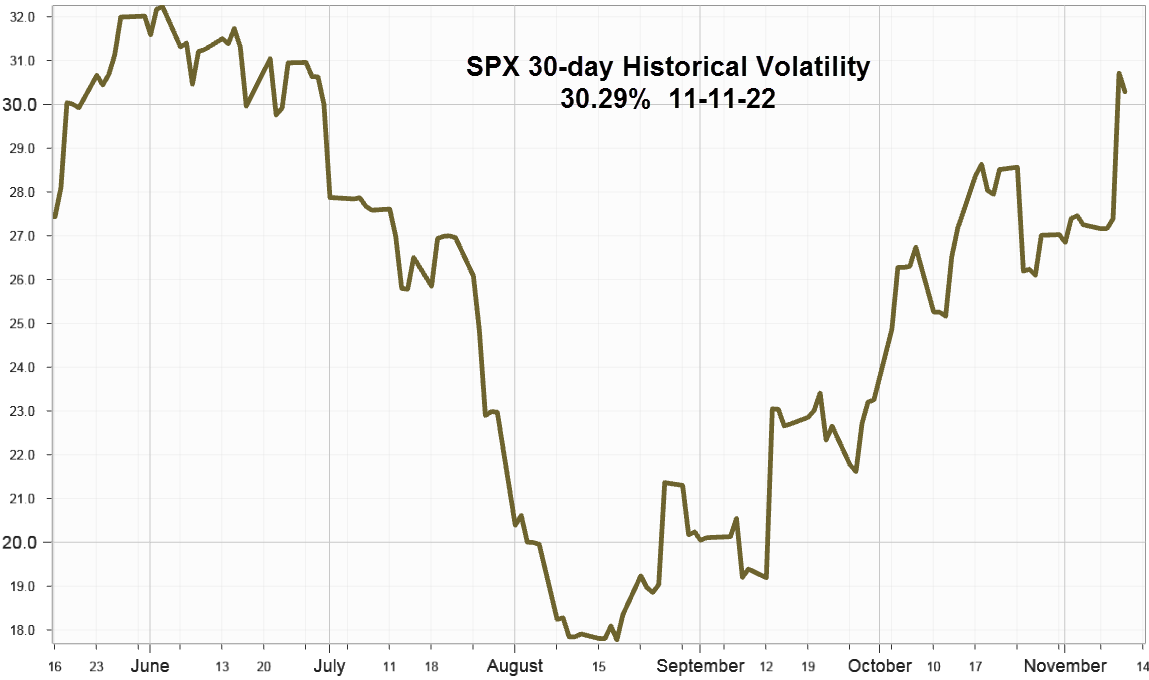
Next, this chart shows the Historical Volatility also called the Realized Volatility at 30.29%, rising quickly after the large SPX advance.

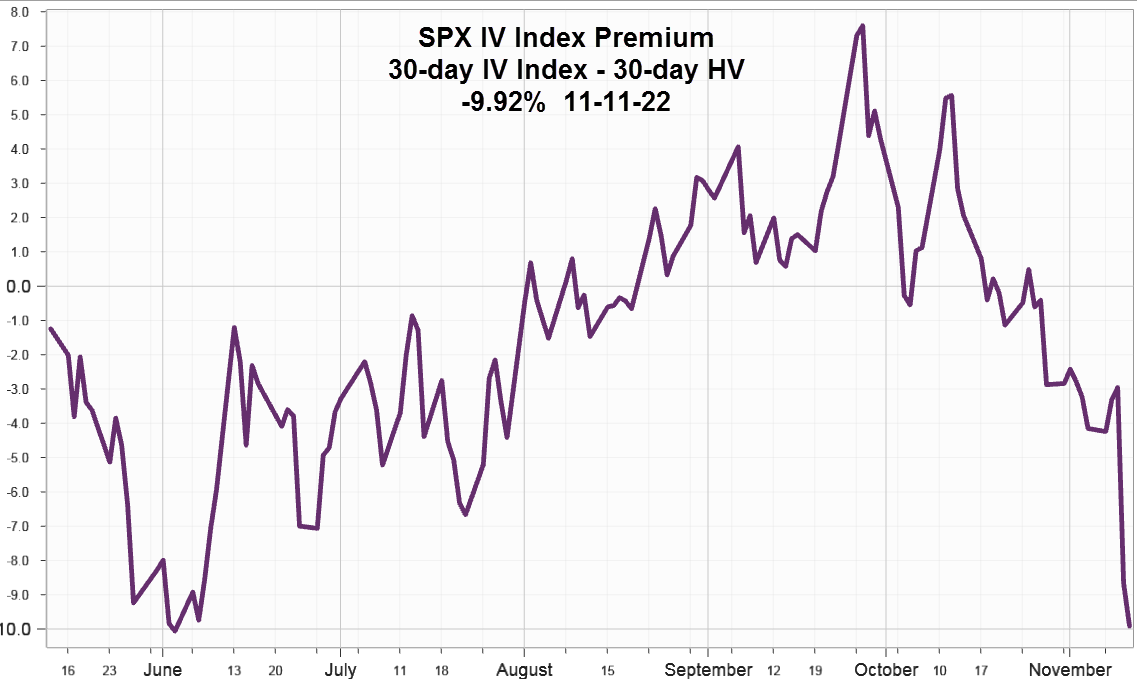
For reference and comparison, this chart shows the premium of implied volatility over historical volatility, a useful way to help decide when options are overvalued or undervalued relative to the movement of the underlying. Friday's premium -9.92%.

Summing Up
The CPI report last Thursday set off a flurry of short covering and hedge position unwinding from the FX market to bonds and rates as well as equities based on the premise that inflation peaked so the Fed may only increase the Funds rate by 50 bps in December. However, Chairman Powell recently made it clear the "...ultimate level of interest rates will be higher than previously expected" and are more important than the pace of increases.
Unless derailed by an unforeseen macro event the S&P 500 Index will soon test two important levels. (1) The measuring objective from the Head & Shoulders bottom pattern (2) the 200-day Moving Average along the downward sloping trendline from the January high. The ability to close above these levels will determine if the October 13 low at 3491.58 marks the bottom or just the end to another bounce before another leg down gets underway.