The FED’s pushback
November 3, 2022
FED Powell pushed back strongly on the notion that the FOMC was looking to implement a pivot in its rate hike campaign. Media reports highlighted the dichotomy of the message from Powell suggesting that the pace of increases could slow while at the same time supporting the idea that higher peak interest rates were to be anticipated.
At first, traders seemed to focus on the notion that the FED was announcing smaller rate hikes for future meetings, a sign generally perceived as a first step towards a dovish pivot by the central bank.
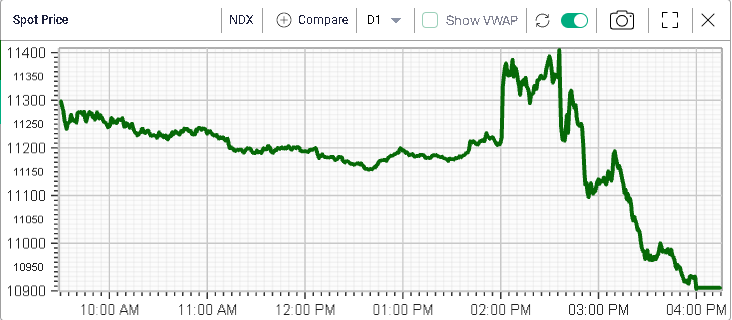
Later on, most took the view that the FOMC’s message remained hawkish as Powell was stating that the terminal rates would most likely be higher than previously anticipated.
The NDX high-low range for the day was around 500 points and the index finished at the lows of the day.
Implied volatility was initially sold very aggressively with 30d IVX for the NDX moving from around 32% to around 30.6% as the headline broke out.
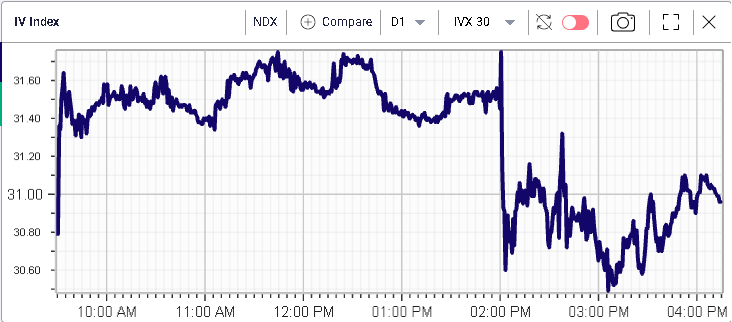
We settled around 31% at the close, around the middle of the meeting’s range although looking at the above charts, it feels that the selloff in spot was met with far less resistance than the rally in implied volatility.
Looking at Fixed Income, 10-year US Treasuries moved slightly lower over the session and now imply a yield of 4.19% (+0.09% over the session). 2-year yield also moved higher by around 0.12% over the session.
Looking at sectors, the Technology space was under pressure as seen most of this year whenever interest rates were seen rising. The sector lost around 3.5% over the session.
Consumer Discretionary stocks lost most over the day with the sector dropping almost 4%.
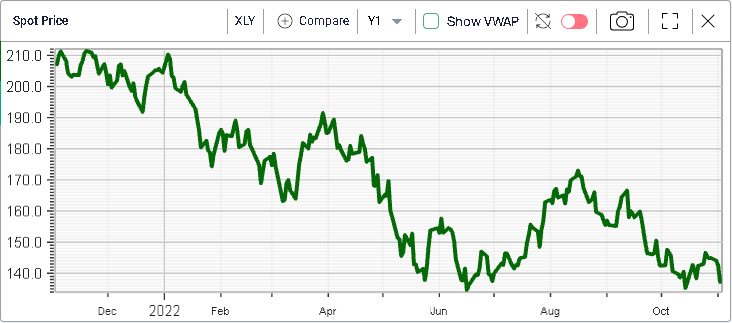
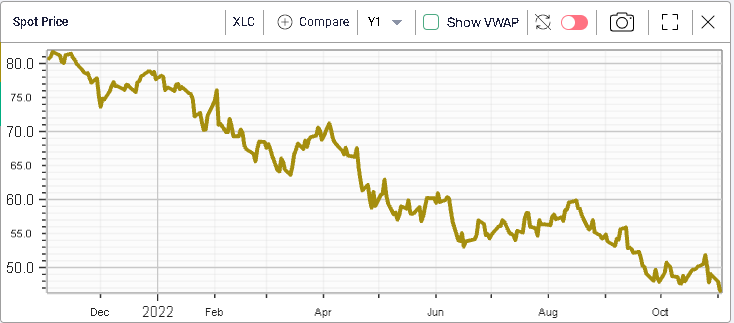
Communications stock also lost almost 3% over the session and, as they did not participate in the recent rally in stocks, find themselves at new 12 months lows having lost more than 40% in 2022 alone.
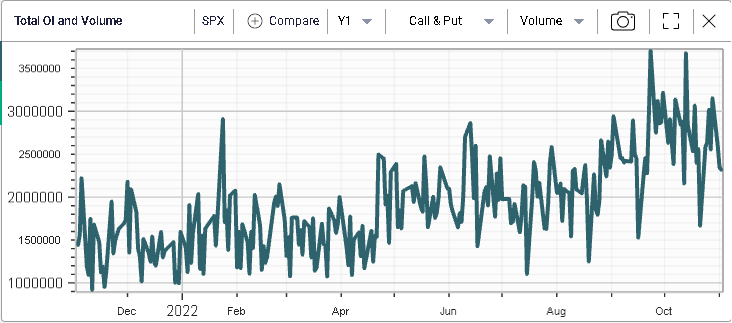
Volume on the SPX were elevated but far off their recent highs, most likely as traders were trying to digest the information provided by the FED. It will thus be important to keep an eye on trades today to get a better understanding of the changes in views from investors following that key event.
