October Bounce
October 24, 2022
It seems fanciful to think equities can bottom before rate hike fear fades away. But Friday's Wall Street Journal article suggested the Fed may wavier in its determination to hike rates and consider slowing the pace of increases in December seemed good enough since equity markets were ready to pounce like a cat on a rat after the S&P 500 Index bounced up off its 200-week Moving Average on Monday.
S&P 500 Index (SPX) 3752.75 advanced 169.68 points or +4.74% last week closing the gaps on Tuesday created by the October 4-7, Minor Island Top. While this bounce seems more substantial than the last one it needs to close back above the October 5 high at 3806.91 before considering it as more than just another attempt to turn the ship around. Seasonally however the record shows major market bottoms occur more often in October than any other month so a close above 3806.91 will increase the odds although rising interest rates remain a major headwind.
Interest Rates
For the week, the 10-Year Treasury Note ended at 4.21% up 21 basis points (bps). The 2-Year Note only gained 1 bps to end at 4.49% for a 10-2 inversion of -28 compared to -48 the week before. However, the 3-month Treasury Bill rate increased 28 bps along with the 20-Year Treasury Bond.
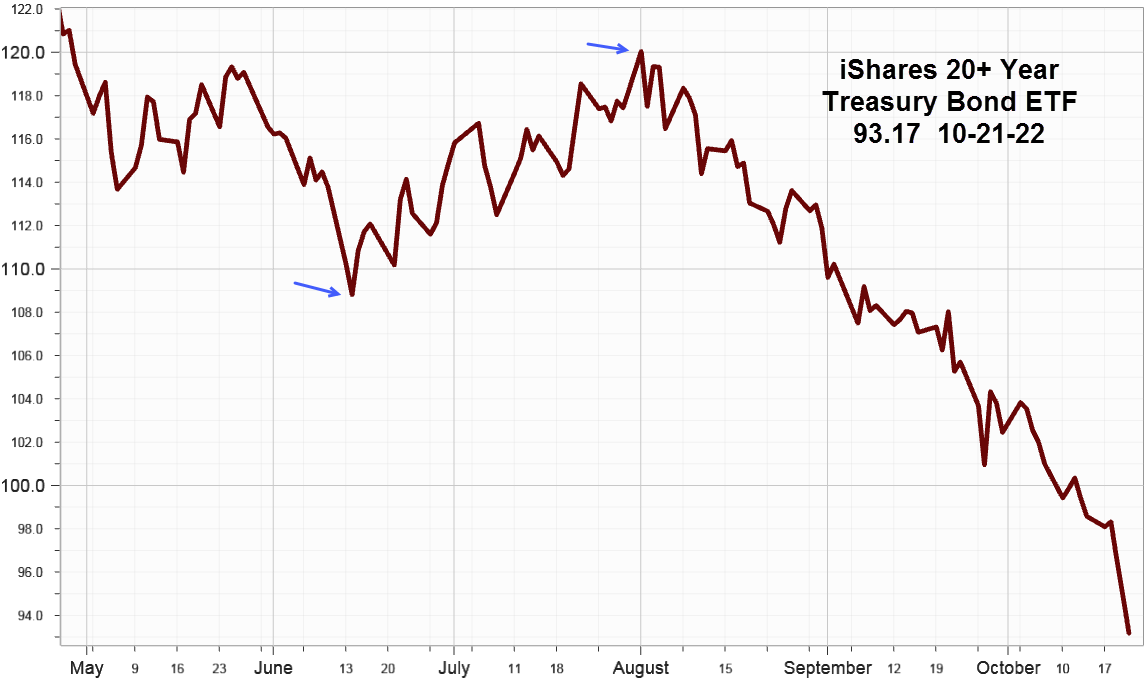
For those claiming the bond market holds the key to the equity market turn the picture appears dreary since some analysts claim a lack of liquidity in the Treasury market. Wednesday bond buyers choked at the long end of the curve causing the yield on the 20-Year Treasury to advance 11bps. Less liquidity means more volatility. This next ETF dramatizes the condition of the Treasury bond market. Without help from the bond market, the equity bounce will have trouble advancing although this week's earnings reports may offer a temporary lifeline.
iShares 20+ Treasury Bond ETF (TLT) 93.17 declined 5.40 points or -5.48% last week. The yield increased to 4.54% up from 4.26% the week before. Since a picture tells the story look at the steep underway.

The two blue arrows show coincide with the equity bounce that began in the middle of June. The current bounce lacks support from the long-term Treasury bond market.
Market Breadth as measured by our preferred gauge, the NYSE ratio adjusted Summation Index that considers the number of issues traded, and reported by McClellan Financial Publications inched up 75.62 points last week to close at -1062.81 as selling slowed. For the bounce to have legs, breadth needs to continue improving.
Implied Volatility
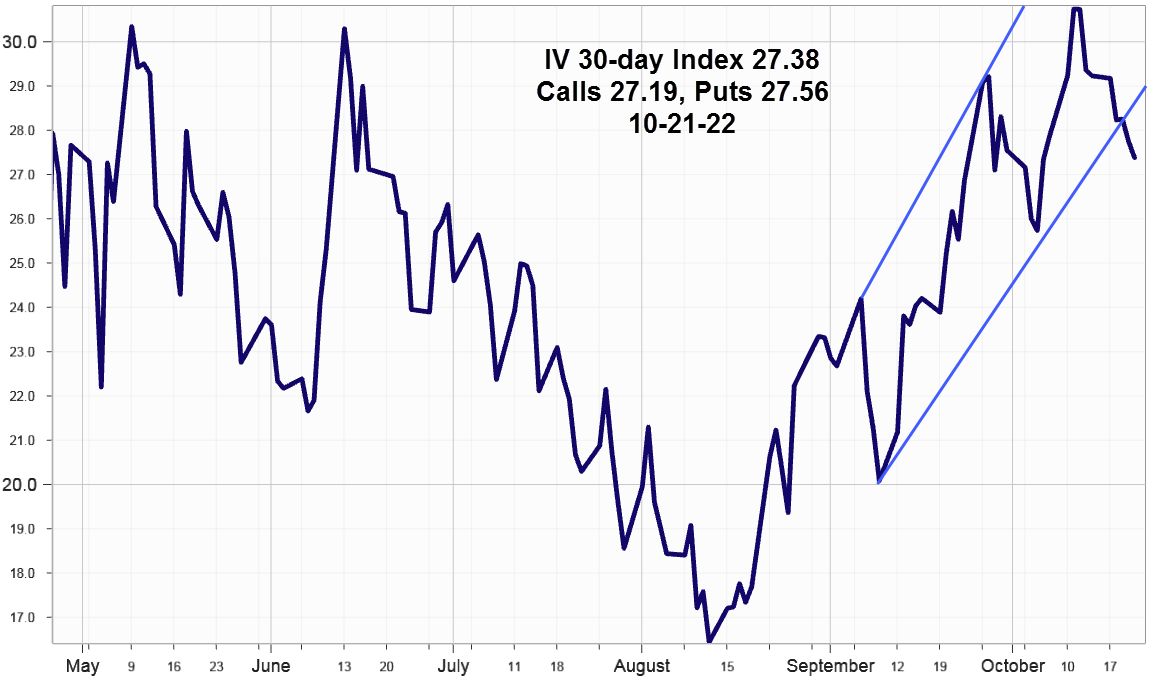
SPX options implied volatility index, IVX slipped 1.85% last week to end at 27.38% with Calls at 27.19% and Puts just slightly higher at 27.56% and based on the channel trendlines appears headed lower.

As a hedging indicator, VIX options open interest declined back down to 8.7m contracts from last week as it typically does after every monthly options expiration. Volume of 607K contracts returned to the normal range supporting the bounce view.
Summing Up
The suggestion that the Fed may consider slowing the pace of rate hikes after the November 1-2 FOMC meeting sparked enough buying on Friday from short covering and hedge unwinding to suggest the start of an October Bounce just before more big cap favorites report earnings this week.
Breadth improved slightly and implied volatility declined slightly some due to monthly options expiration on Friday.
However, interest rates remain the big bear in the woods especially at the long-end of the Treasury bond market. Some help from the bond market would improve the odds for a sustainable October Bounce. The bulls say watch for the Treasury bond market to stabilize.