CPI Figures take center stage
October 13, 2022
Today is the big day with the market’s attention turning towards the US CPI. Figures are expected at +6.5% YoY compared with a prior of +6.3%. During the European morning, German HICP data was inline with expectations at +10.9% YoY.
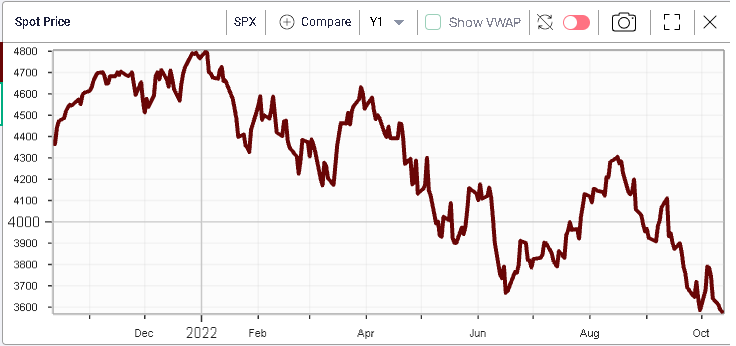
Going into the release markets continued to drift slightly lower as they have done every day this week so far. We are trading at the lowest level in a year for the SPX.

The drift lower in spot prices could be a sign that speculative traders are positioned slightly long and looking to reduce their exposures into the figures. This could create a very strong urgency to buy should the numbers come slightly better than expected as those traders might well be looking to rebuild their positions.
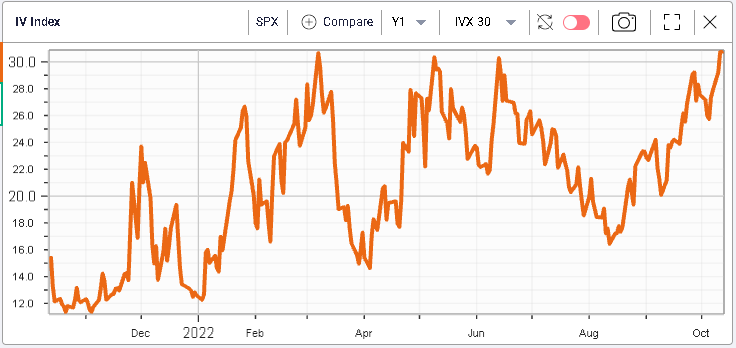
From an implied volatility perspective, we stabilized above 30% for the second day in a row.

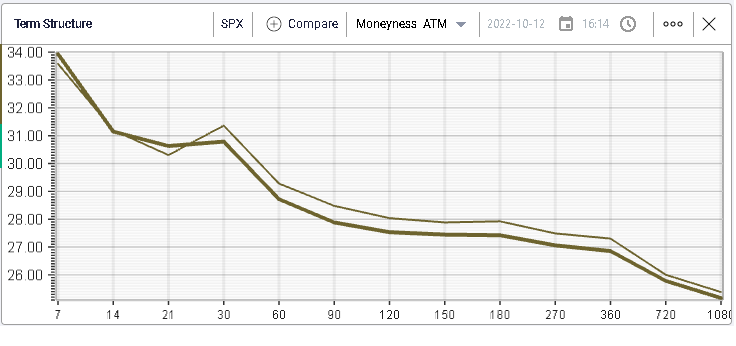
The term structure was largely unchanged in the SPX with longer dated maturities remarked slightly lower over the day (bold line = last close).

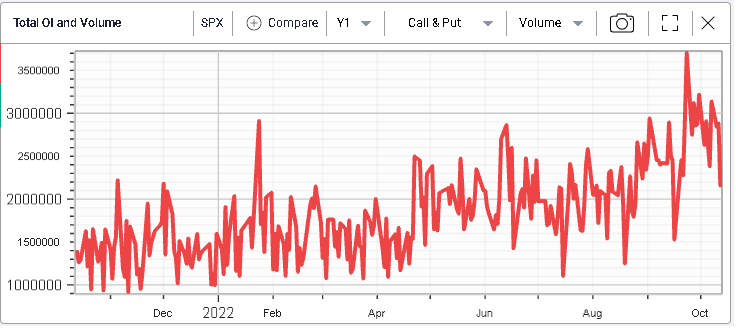
Volumes also dropped yesterday in options space with around 2.15m contracts exchanging hands on the SPX.

Outside of major indices, the overall activity seemed pretty light and there is a feeling that market participants are now sitting on their hands waiting for the important CPI figures to be released.
The best performance of all DJIA stocks yesterday was for JPM which gained 1.62%. The worst performer was WBA down 2.05%. In a nutshell, not much to get excited about for large cap names at least.