New Low No Big Deal
October 3, 2022
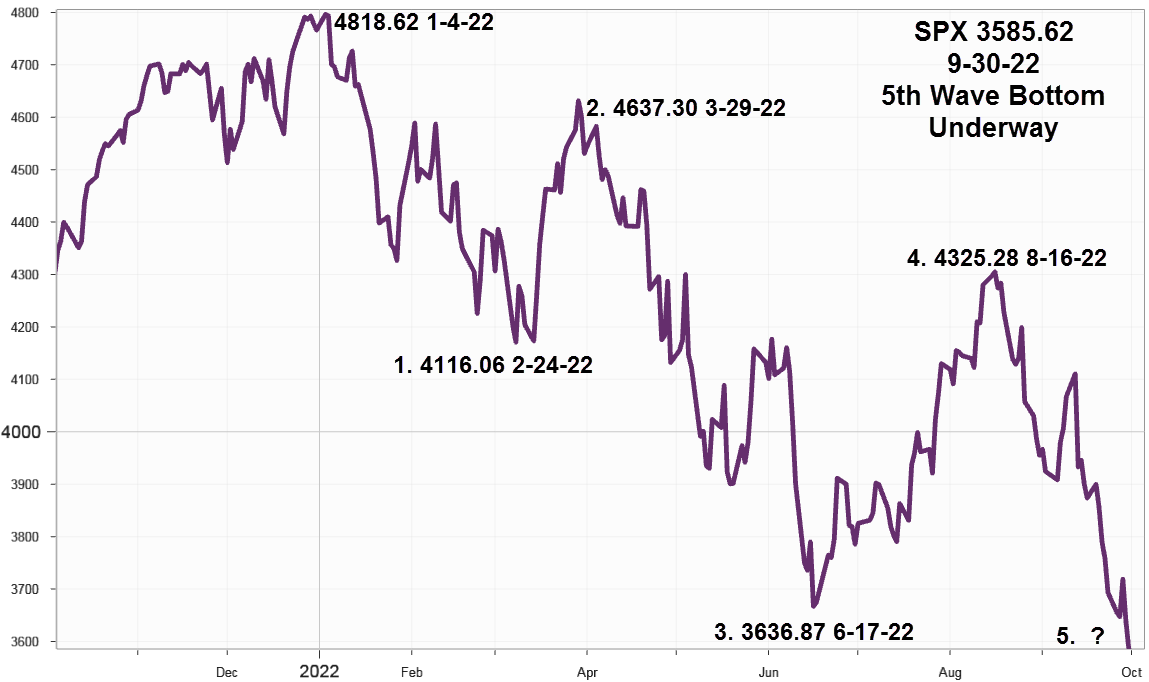
Typically when the bulls get restless they stampede toward a narrow opening in the fence and there were some signs of that on Friday September 23, but this week their exit seemed more orderly, without panic, even as S&P 500 Index closed below the previous June 17 low at 3636.87 on Friday.
S&P 500 Index (SPX) 3585.62 slipped 107.61 points or -2.91% last week closing near the low for the day and below the June 17 low at 3636.87 to start a new leg lower. The 14-day relative strength index (RSI) at 28.47 slightly below the previous Friday at 28.90 continues to suggest it's oversold and due for another bear market bounce. For this indictor readings below 30 signal an oversold market.
The new low created a potential new technical pattern, an Elliott 5 wave sequence from the January 4818.62 high. The labeled waves follow, although it's likely still a bit early for the final bottom.

Interest Rates
For the week, the 10-Year Treasury Note ended at 3.83% up 14 basis points (bps). The 2-Year Note up a bit less, +2 bps to 4.22% for a 10-2 inversion of -39 bps compared to -51 bps the week before. Recently the Fed raised the fed funds rate by 75 basis points to 3%-3.25% and issued new projections showing rates peaking at 4.6% next year with no cuts until 2024. Should this hold it means another 135 bps to go. Who knows if it will be enough? Remember, if it's in the news it's in the price and this is certainly in the news. What's not in the news but will be shortly are Q3 earnings reports and guidance updates.
Market Breadth as measured by our preferred gauge, the NYSE ratio adjusted Summation Index that considers the number of issues traded, and reported by McClellan Financial Publications decelerated last week dropping 428.32 points to end at -942.64. Heading south in a hurry this reliable indicator paints a dour picture suggesting it will be some time before equities bottom.
Implied Volatility
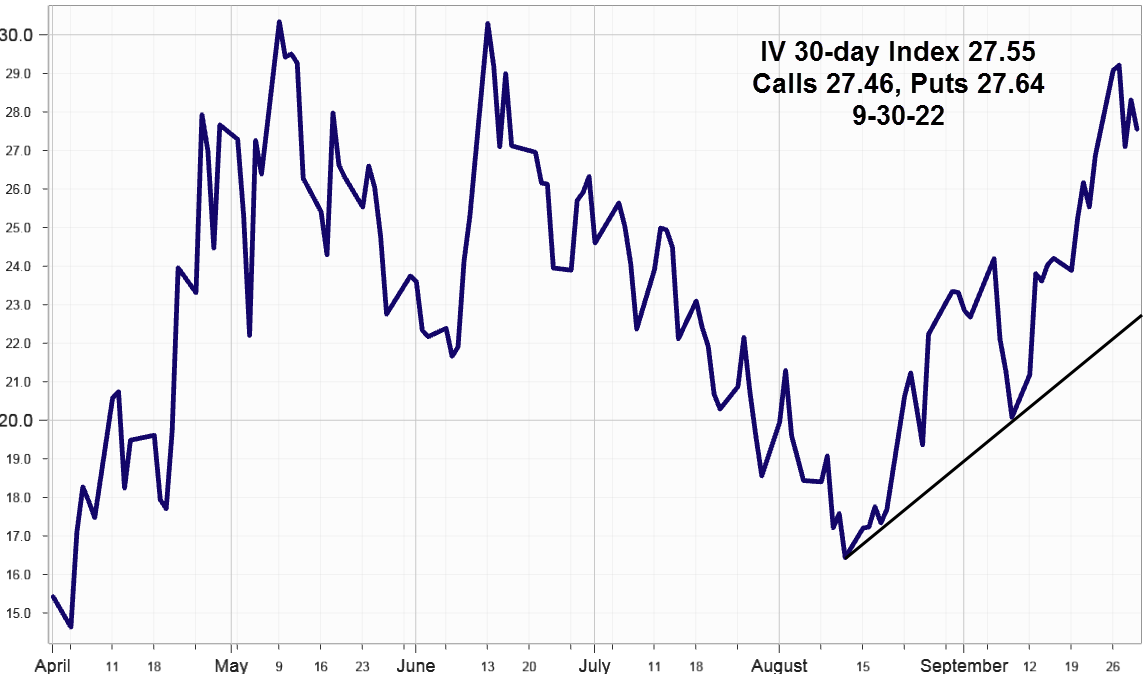
SPX options implied volatility index, IVX advanced slightly +.69% to 27.55% from 26.86% on September 23 with the Calls at 27.46% and Puts at 27.64% about equal.

Rising implied volatility reflects a willingness to bid up option prices for portfolio protection by those concerned about deteriorating economic conditions, or a possible recession accompanied by declining earnings. Adding collars, long put spreads, short call spreads and other combinations translate into rising put/call ratio readings. The equity only put call ratio ended Friday at .77 considerably lower than 1.02 on September 23 although the SPX closed below the June 17 low last week.
Summing Up
The Fed expects rates to peak at 4.6% next year with no cuts until 2024. It's understood there's an unstated qualifier: Unless something breaks. Last week the Bank of England announced it would buy long-dated gilts to stabilize the bond market citing a potential risk to the financial system due to rapidly rising rates.
Although the S&P 500 Index closed below the June 17 benchmark low at 3636.87, several indictors including the put call ratio actually improved from September 23 levels, although option implied volatility inched up slightly, the call and put implied volatility equalized after several weeks skewed to the puts.
The new S&P 500 Index low dashed hopes for the formation of a double bottom replaced by a developing Elliott 5 wave pattern implying lower lows to come. For those seeking the final cyclical bottom, here's how Simon & Garfunkel might describe it. "Slip slidin' away / Slip slidin' away / You know the nearer / your destination / The more you're slip / slidin' away" Paul Simon October 1, 1977