Stories that don’t attract attention
September 21, 2022
A highly expected FOMC meeting will take center stage today as it did over the past few sessions. Yesterday saw the SPX settle 1.13% lower with the NDX outperforming down 0.85% and the DJIA in between losing 1%.
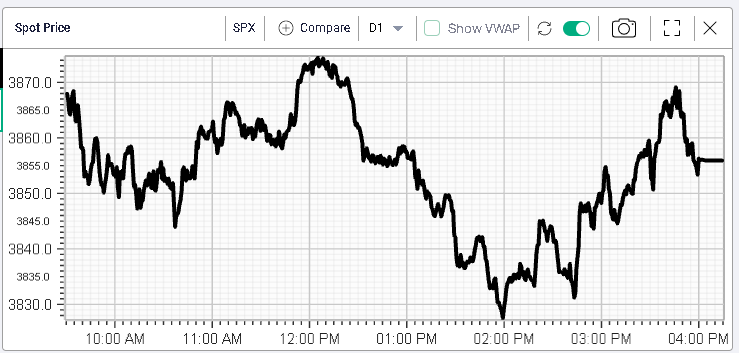
The intraday price action was fairly weak until early afternoon when buyers emerged and pushed price 30 points higher than their low point on the SPX.
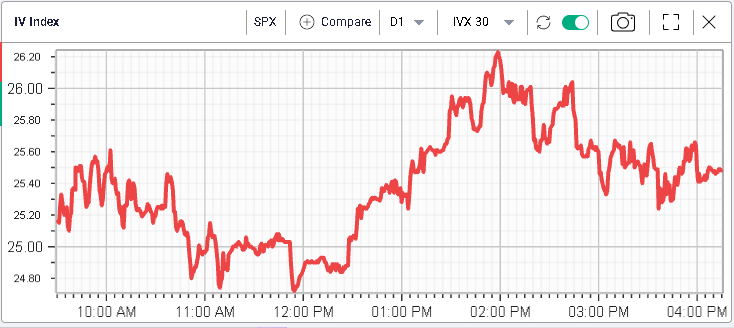
Implied volatility for the SPX tracked spot prices fairly closely and settled around 1 point higher for 30 days term.
As pretty much all traders are now focused on whether the FED will hike by 0.75% or 1%, it is worth having a look at some of the moves that have been happening under the radar.
One stock for which implied volatility has been increasing quite rapidly over the past few days is BIIB. On the below chart, we look at the 30 days implied volatility index (IVX30) over the past 5 years.
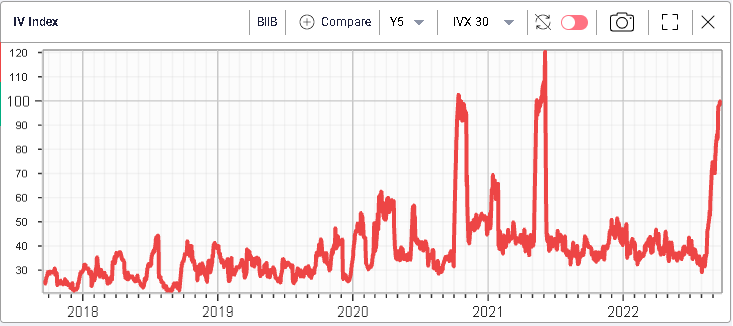
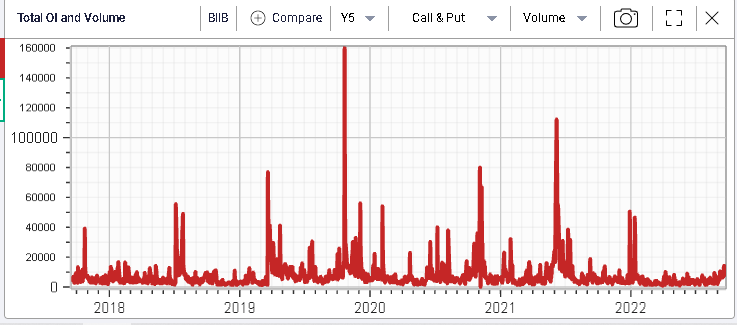
Implied volatility seems to have jumped almost 70 points in a straight line since the start of August. This is happening at a time when volumes for calls or puts seem relatively subdued compared to history.
The same can be said about realized volatility with a move yesterday of only 2.4% on the downside and a 20 HV around 33%.
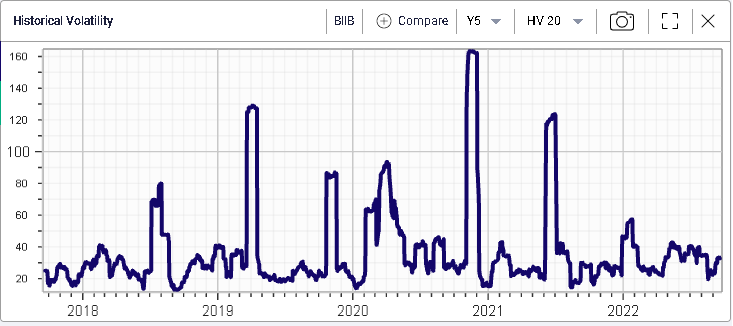
This has created a situation where the IV Premium is now pretty much at its highest level of the past 5 years.
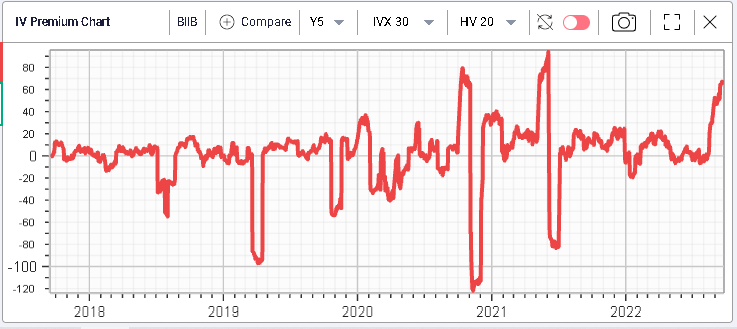
This phenomenon has been happening across multiple other names and it is worth studying those to understand whether this volatility remark is warranted or not.
For instance, in NFLX, 30d IVX has gone from 46 to 69 in less than 10 days. In this case, it seems to be related to the stock’s earnings that are expected on the 18th Oct’22 with traders looking to put on options position into the event.
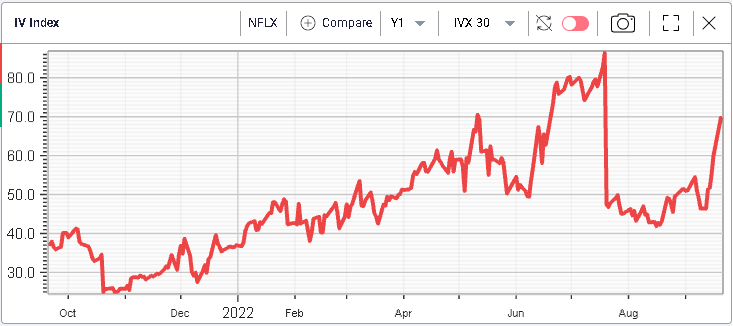
The volume of calls and puts traded in the name has increased over the past few days as well.
