Reducing positions into the FED
September 20, 2022
As the new week started, European headline indices sold off quite aggressively taking their US counterparts with them during the overnight session. Indices traded around 1% lower but as American traders got into office, indices started to turn higher.
By the open, SPX was still trading around 0.6% lower but continued to rally throughout the session and managed to finish in the green by 0.7%. The NDX gained 0.77% and the DJIA 0.64%.
It will come to no surprise that this week’s main event will be the FOMC meeting on Wednesday. As such, prior to the meeting, it is likely that we will see position squaring by participants.
Expectations for that meeting have been going up since last week’s higher CPI print with participants set for a 0.75% hike while some or calling for a full percentage point.
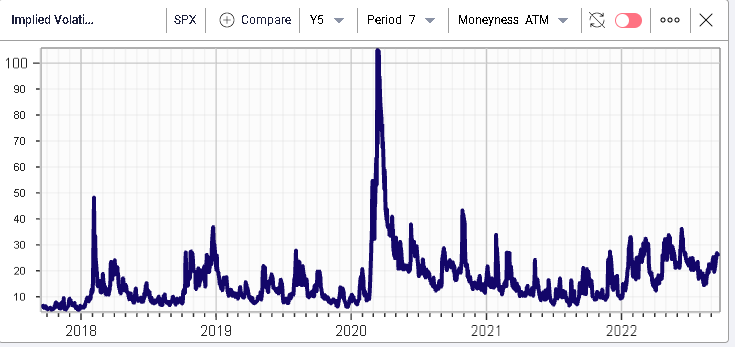
Going into the FOMC meeting, weekly implied volatility for the SPX has been going up although it remains far off the levels seen over the past few months.
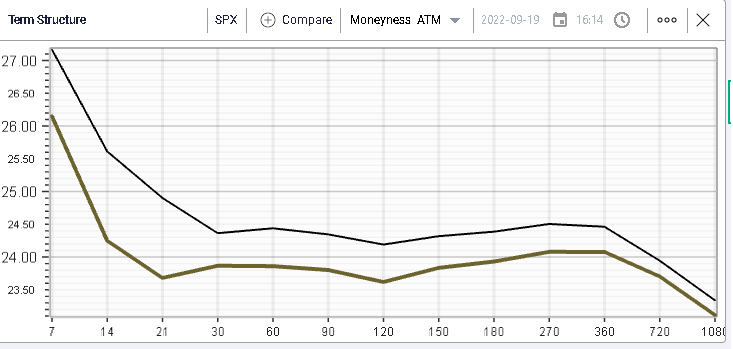
In fact, the generally subdued price action in Equity indices yesterday resulted in a compression of implied volatility across the curve as seen in the below screenshot.
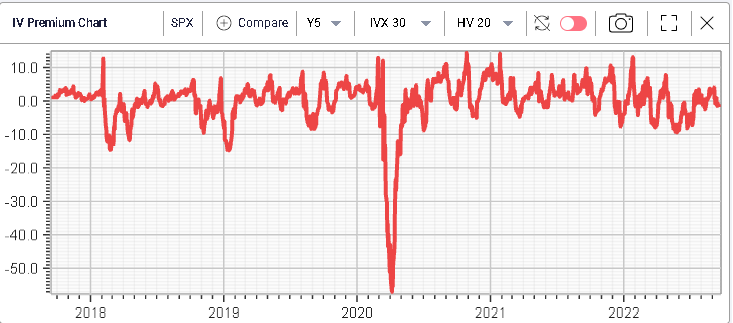
Looking at the historical IV Premium chart, it seems that market makers are happy to offer volatility at the same level as where it has been realizing over the past month.
From a sector perspective, we note the underperformance of the Healthcare segment (which coincidentally was the strongest performer last week). The Energy space also struggled as Crude Oil dipped to $82 around the start of the US session before recovering to $85 by end of day.
On the upside, consumer discretionary stocks outperformed gaining around 1.5%. Looking at the DJIA components, NKE and AAPL were the two best performing stocks as shown on the below spot price charts, gaining respectively 3% and 2.5%.
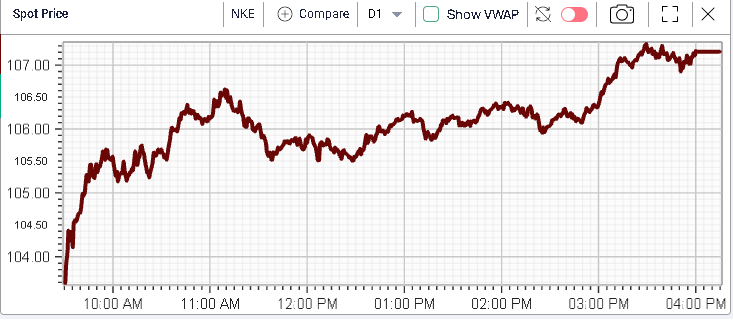

Zooming out, those names are amongst the worst performers of the DJIA over the year with AAPL dropping 15% and NKE losing almost 35% YTD.
On the other hand, yesterday’s underperformers included names that did best both last week but also in 2022 with for instance MRK losing 1.23% and JNJ dropping 0.8% on Monday. Those names are respectively up 12.7% and down 3% YTD.
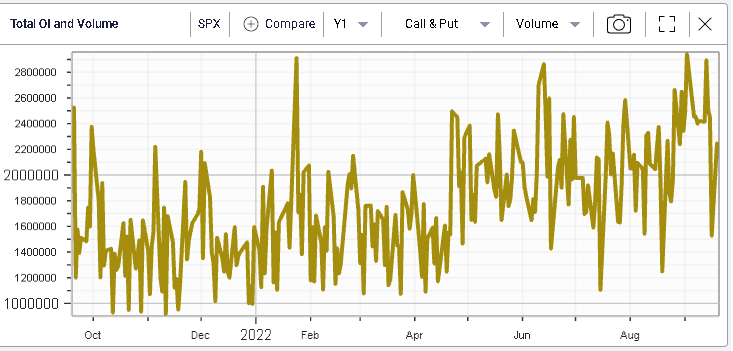
This overall reduction of positions and exposures by market participants did not really translate into an increase in the overall volumes of options traded with slightly more than 2m contracts exchanging hands on the SPX yesterday.
