Strong buying pressure towards the end of last week
September 12, 2022
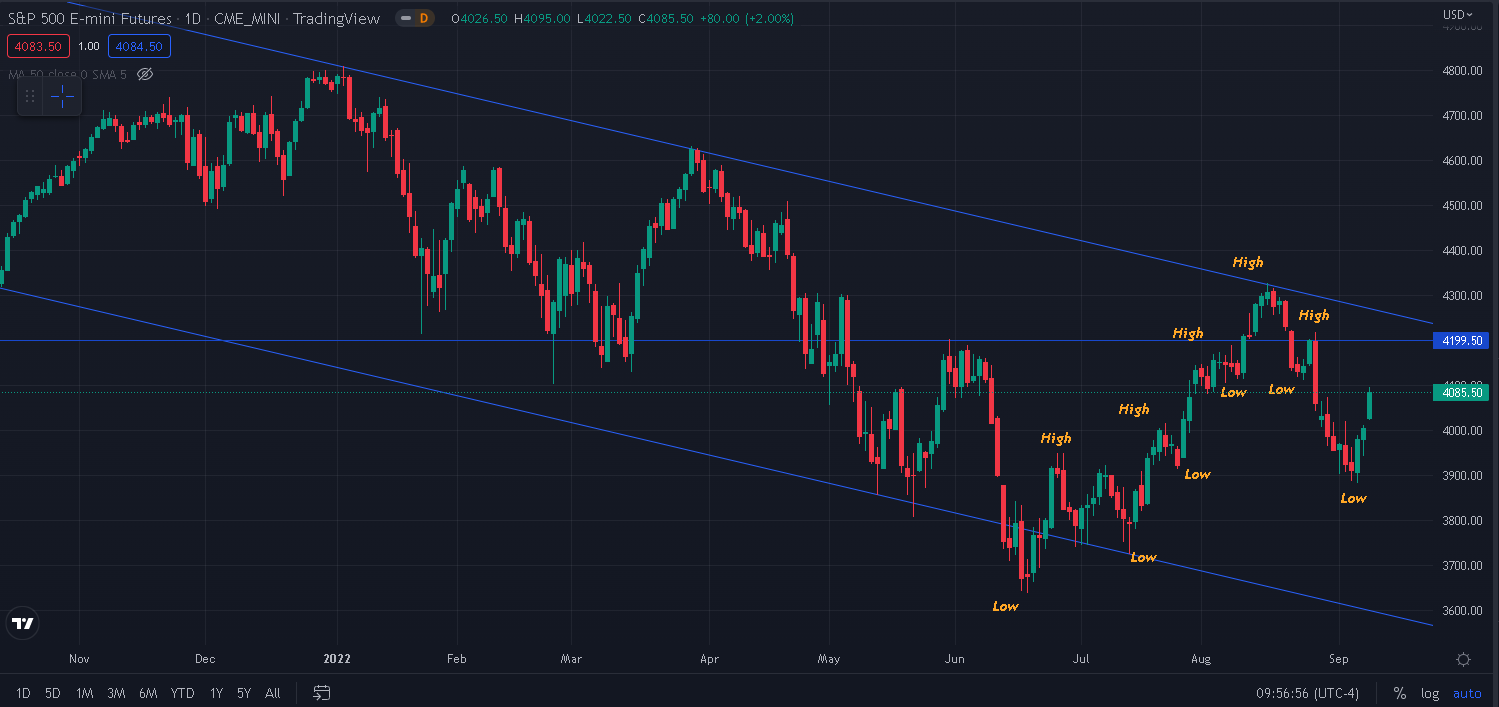
US headline indices turned around last week and started moving higher again after making a local low point on Wednesday. The overall downtrend remains in place for now and the next pivotal level defined as the last local high is seen around 4,200 while on the downside the first major level is seen around 3,900.
Source: Tradingview.com
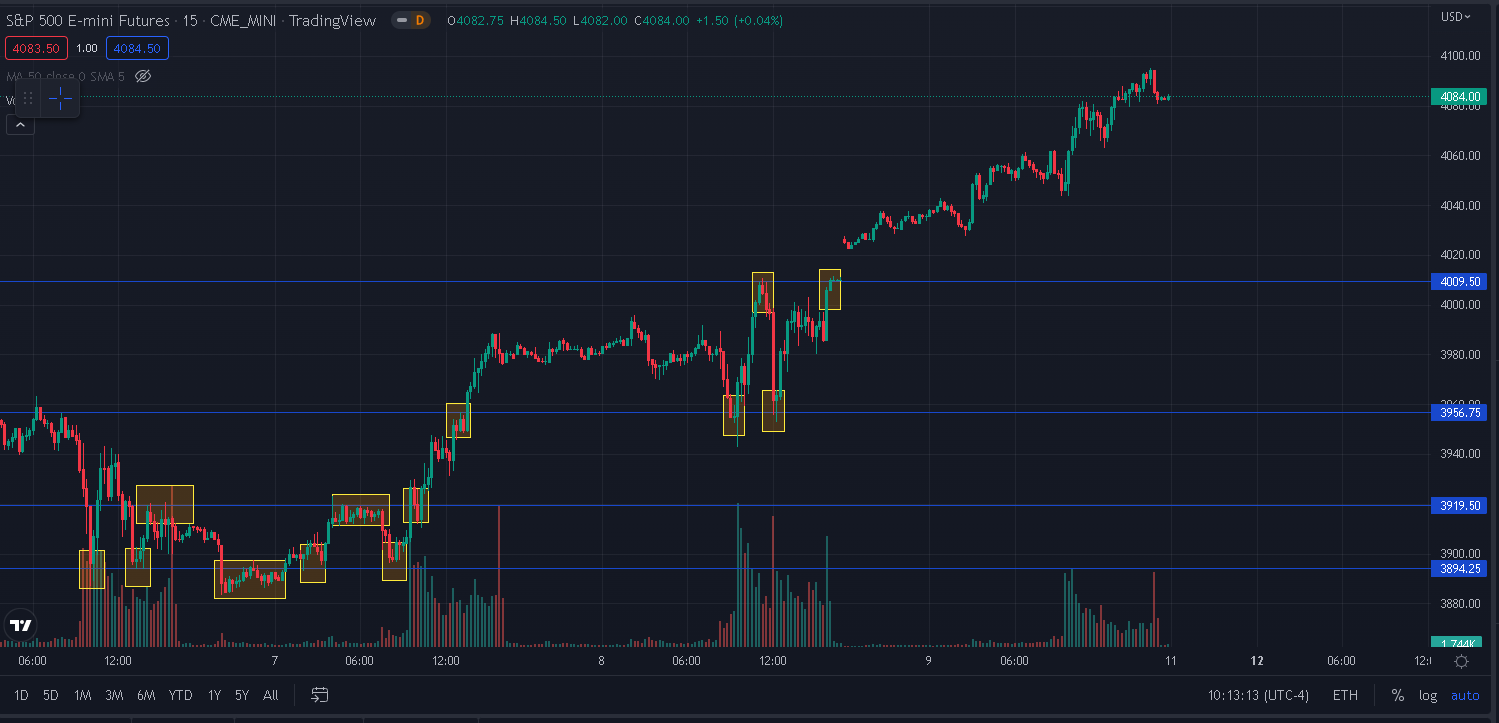
Looking specifically at the levels reached last week, we can identify four key prices where bulls and bears fought each other. First on the way down the 3895 levels and then 3920 were key levels where bulls stepped in to halt the fall. Second, on the way up, bears mobilized at 3957 and 4010 but were defeated.
Source: Tradingview.com
Friday felt like a short squeeze with bears who increased their exposure over the week were forced out of positions in a typical bottom left, top right price action.
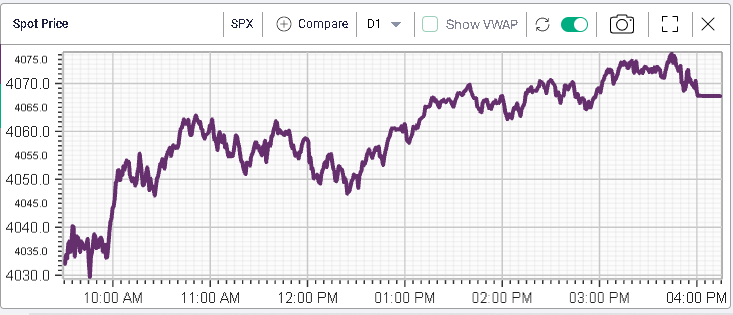
Over the week, the SPX gained 3.65% and the NDX pushed higher by 4.05%. European indices lagged with the German DAX gaining a mere 0.2% and the French CAC up 0.7%.
The rate hike by the ECB this week was a welcome event in fighting inflation but the concerns from investors continue to pile up as the risk of an energy driven recession towards the end of the year is elevated.
Over the week, implied volatilities dropped as seen below on the term structure of the NDX. 30d IVX lost more than 3 points for the NDX over the week.
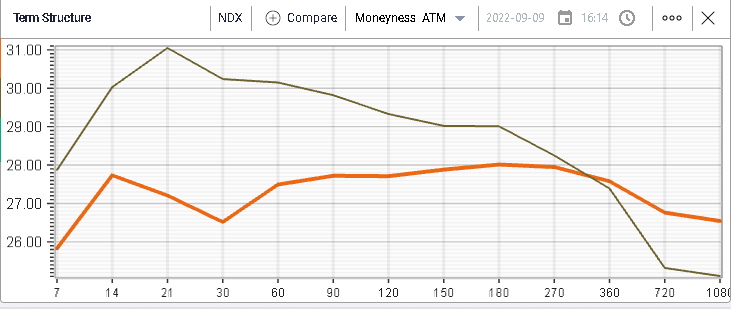
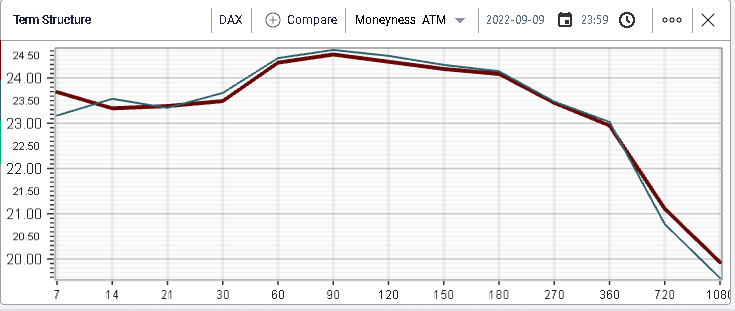
In contrast, European implied volatilities held their ground and finished the week largely unchanged in a sign that the perception between the two regions is now very different.
In terms of sectors over the week, the consumer discretionary segment showed the best performance gaining 5.8%. Materials also did well close the week around 5% higher while Financials and Healthcare sectors were both around 4.5% higher by Friday’s close. The clear laggard for this week was the Energy space, weighted by a volatile price action in Crude Oil that finished the week slightly lower.
Looking at the DJIA components, some of the Financials had a really good week with AXP finishing almost 6% higher and V gaining 3.5%. We also saw JPM gain 4.75%. NKE finished 5% higher while CRM was around 5.75% higher by Friday’s closing bell.
In terms of laggards, names like INTC (+0.9% over the week) and AAPL (+1% over the week) were at the bottom of the performance charts. It is worth noting that over week, all of the 30 components of the DJIA finished higher.
Using the REST API from Ivolatility.com, we are able to create a measure of the net number of stocks that finished the week higher or lower. For instance, a measure of -100 would mean that all stocks within the DJIA finished lower while a measure of +100 would mean that all stocks finished higher.
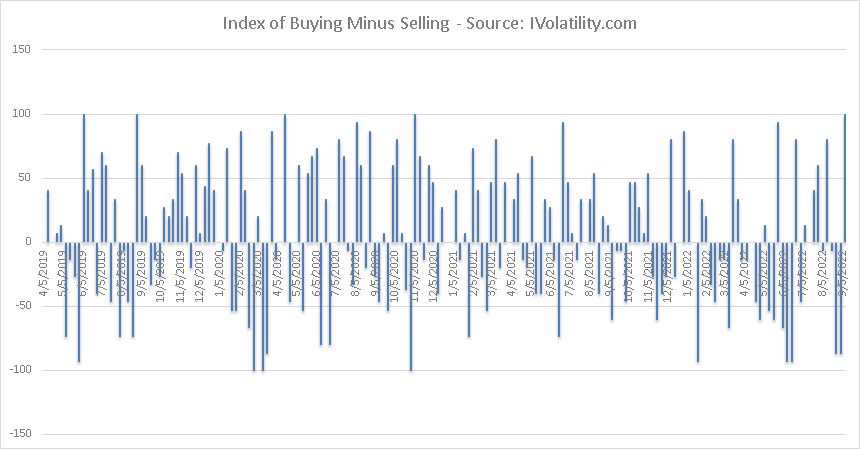
Looking at the above, we can see that it is not that frequent to see all components of the DJIA higher over a given week adding to the significance of last week’s rally.