Finding elevated implied volatilities
September 2, 2022
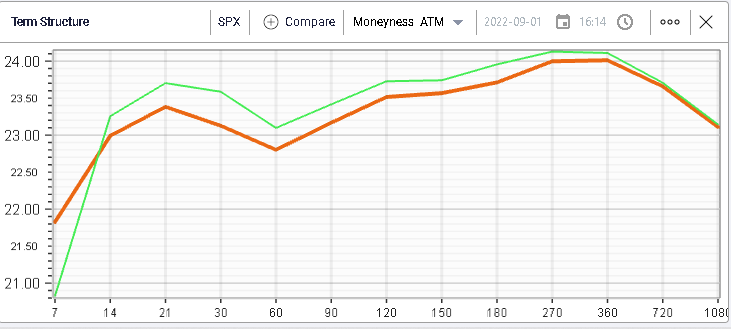
Another slow session yesterday despite some noticeable volatility intraday, the market settled up 0.3% for the SPX, unchanged for the NDX and higher by 0.46% for the DJIA. Implied volatility moved lower across the board except for 1-week options which were in demand ahead of NFPs today.

As realized volatility seems to be subdued in the current environment, it is interesting to take a look at how single stocks are faring in the current regime.
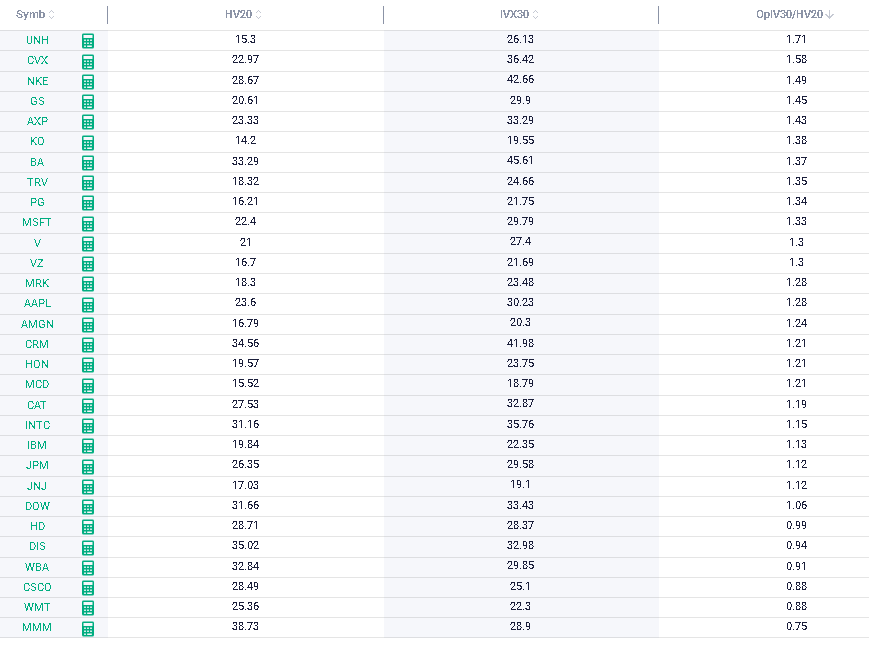
In IVolLive, the stock monitor offers a simple way to get that information across multiple stocks in one go. For instance, in this example, we look at the components of the DJIA index. We use three columns, the IVX 30 which is an index that estimates the implied volatility for an underlier over the next 30 days, the HV20 which is the historical volatility over the past 20 days. The comparison of the two should give us some information about what market makers are now pricing and expecting.
The final column that we use to get to that result is called Opening IV30 / HV20 and displays the ratio of implied over realized.

Looking at the above, we can see that almost all names are currently showing an implied volatility above the historical volatility.
At the top, UNH shows the greatest implied volatility premium relative to the historical volatility with the IV30 around 71% higher than the most recent observation of historical volatility.
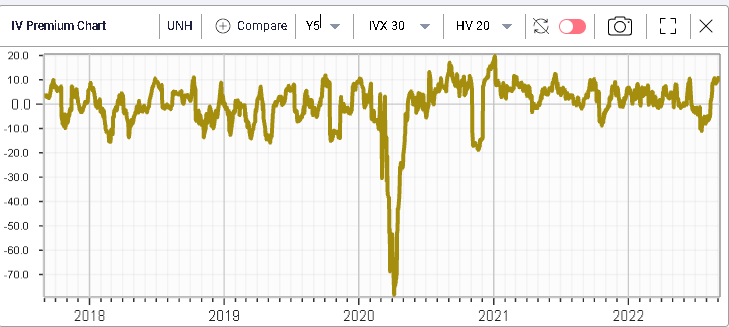
On the below chart, we display the 30d IVX / 20d HV IV Premium Spread over the past 5 years. The current value looks very elevated compared to history.

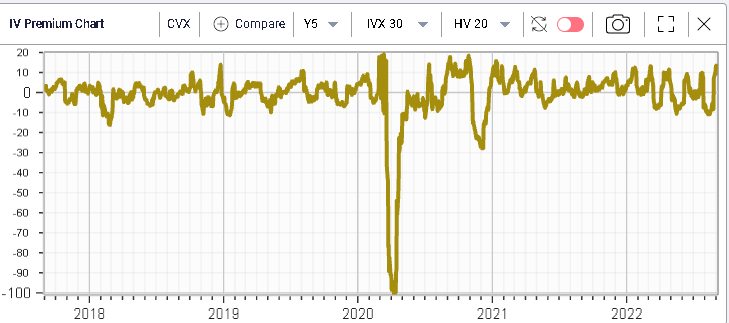
The same is visible for other names such as CVX shown below.
