Bull Bounce Over
August 29, 2022
Following last Friday's staggering response to Jay Powell's comments at Jackson Hole, it's time to relegate the S&P 500 Index Head & Shoulders Bottom last shown here to the failed pattern file. After stalling out beneath the 200- day Moving Average on Tuesday August 16, it was doing just fine clicking higher until it reached resistance at the 200-Day Moving Average when it said "that's it no more."
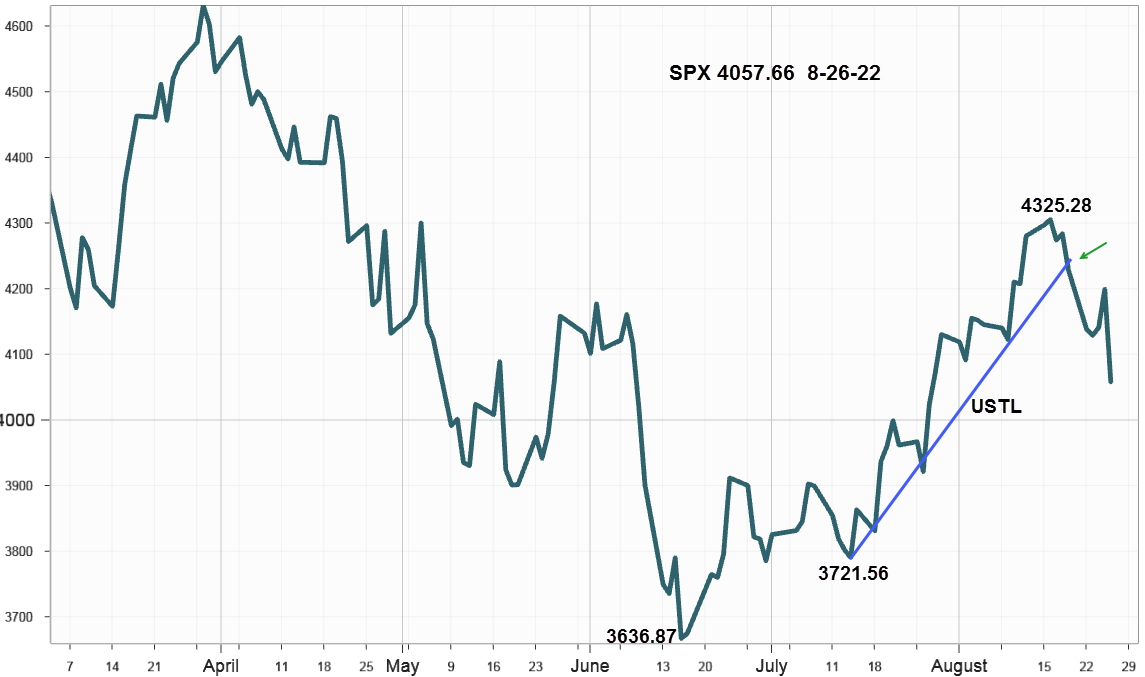
Real trouble began on options expiration Friday August 19, when it closed below the upward sloping trendline, USTL from the right shoulder at 3721.56 of the no longer active Head & Shoulders Bottom pattern, shown in the chart below.
Last week's Resistance Prevails details some of the other key reasons for the August 19 decline that changed the trend. See the small green arrow below.
S&P 500 Index (SPX) 4057.66 dropped 170.82 points or -4.04%. On Friday after Jay Powell's comments, it declined 141.46 points or -3.37%, the largest loss since June13 at 3.88%.

Such a dramatic break below the USTL greatly increases the odds it will attempt the retest the June 17 low at 3636.17. However, the 50-day Moving Average just below at 3996.19 will likely slow the decent.
Seasonally the record for September shows weakness and this year with rising interest rates could make it especially weak, but now it seems rising rates are discounted in the price.
Market Breadth as measured by our preferred gauge, the NYSE ratio adjusted Summation Index that considers the number of issues traded, and reported by McClellan Financial Publications declined 219.30 points last week ending at 610.87 after reaching 859.79 on August 18before turning lower on August 19.
Implied Volatility
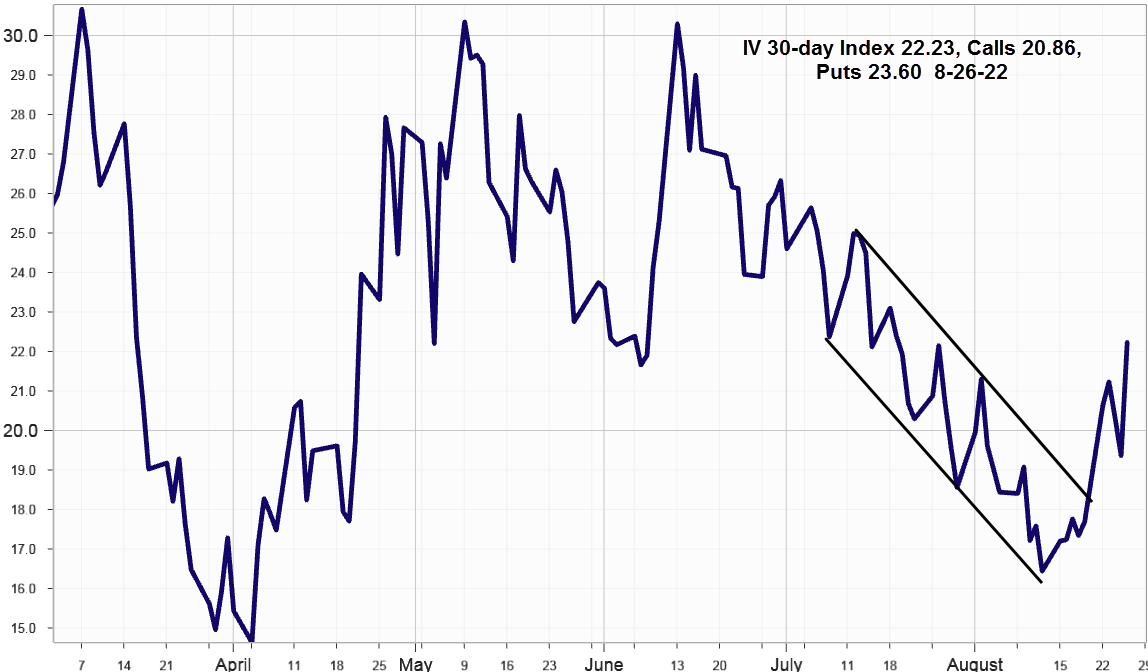
SPX options implied volatility index, IVX jumped up 2.87% last week to 22.23% from 17.69% on August 19. The skew between the Calls at 20.86% and Puts at 23.60% along with breaking out above the downward channel adds trend change confirmation.

Summing Up
Last Friday's decline after Jay Powell's comments dramatically confirmed that the bull bounce ended on August 19. For now equity markets apparently got the message and accept that interest rates are likely to continue rising although the bulls see opportunity in the pullback, the bear have the advantage. One last thought: it seems the fixed income market already expected Jay's remarks as rates only increased one or two basis points across the curve.