Bull spreads in BA and Bear spreads in VZ
July 22, 2022
The ECB meeting yesterday delivered a greater than anticipated rate hike with the European Central Bank raising rates by 0.5% against expectations of 0.25%. As with the FED, the guidance that was given at the prior meeting was quickly forgotten the Council had to deal with a Euro flirting with parity, increased inflationary pressures over the past few weeks and the prospect of an energy crunch for the final months of the year.
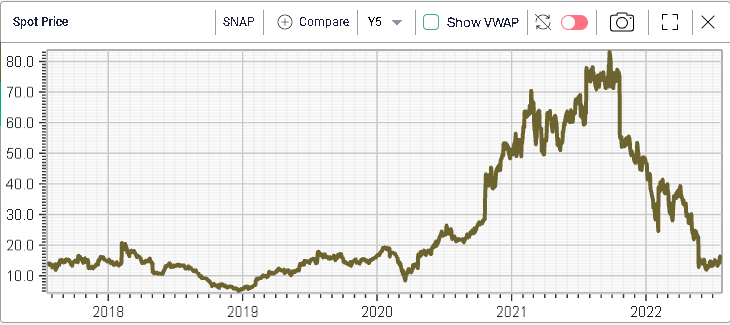
Yesterday was also the day of earnings for SNAP. The stock has now lost 80% of its value since the 2021 highs and in the overnight session, SNAP is trading around $16.35, down around 28.7%.
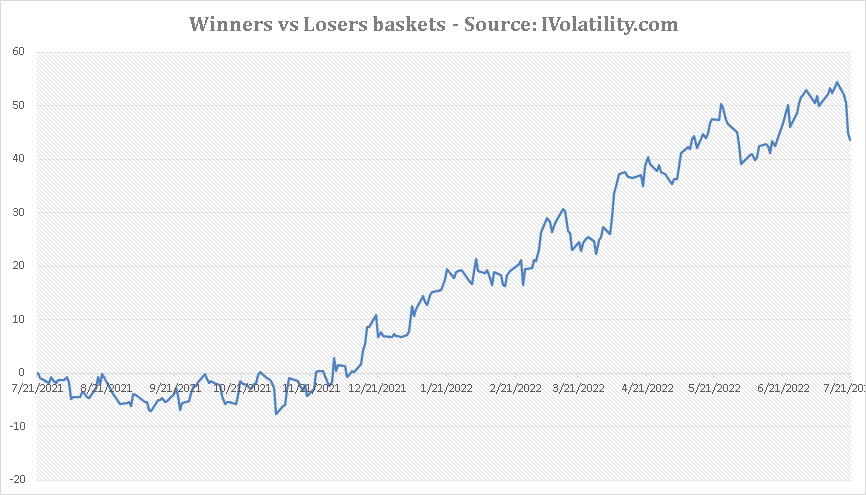
Our losers vs winners basket (see yesterday’s market update for more details) continued to perform well yesterday with year to date winners losing 0.6% on the day on average while year to date losers gained 0.95% on average over the session.
Over the session, the best performing sector was the consumer discretionary space gaining 2.3% on the day. Healthcare stocks also rebounded by 1.6%. On the downside, the Energy space struggled and lost 2%, roughly in line with the move in Crude Oil.
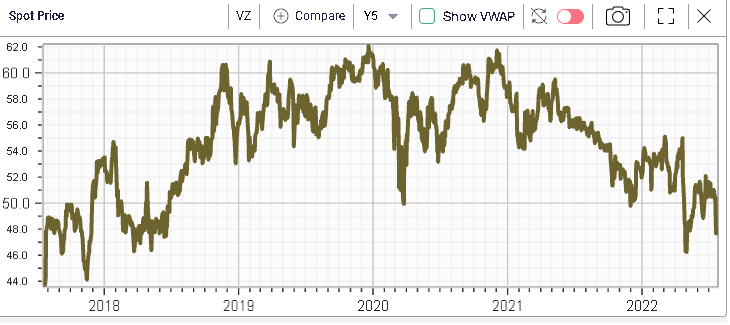
Within the DJIA components, VZ remained weak yesterday losing around 2.9%. The name was one of the more resilient one in the first half of the year but has seen some weakness of late. It is now 9% lower than where it settled at the end of 2021.
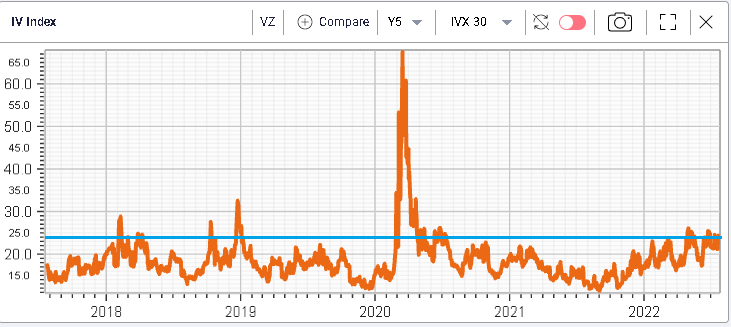
Implied volatility in the name has moved higher recently and has now reached elevated levels from an historical perspective (over the past 5 years).
For traders looking at hedging structures in the name for instance bear vertical spreads, using the RT Spread Scanner is a great way to get an idea of the most attractive possibilities offered.

The most attractive combination from a risk to reward perspective is offered by the 43/40 bear vertical spread expiring on the 26th Aug’22. The structure only costs $19 for a potential 2 standard deviation gain of $235.
The company is expected to report before market opens today so it will be interesting to see how price and volatility react to this set of numbers.
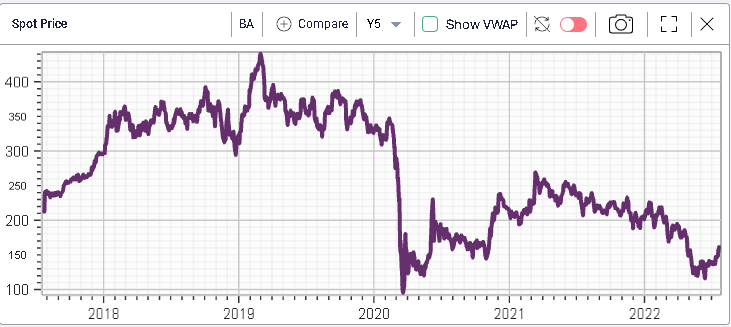
Looking at BA, it had another good day yesterday gaining almost 2%. The stock sold off very aggressively in the first half but seems to have generated some renewed interest recently. Around the June expiration, BA had lost around 42.4% on the year but it is now only down 22.35% on the year.
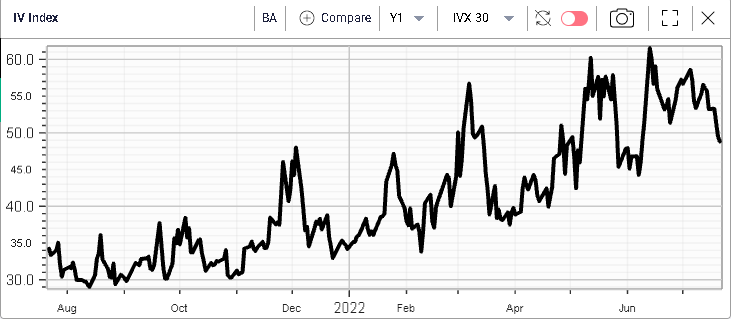
Volatility in the name has dropped from its recent highs but remains fairly elevated compared to the last year.
Looking once again at the RT Spread Scanner for bull vertical spreads, we find the following structures, sorted by attractiveness on a Risk/Reward measure.
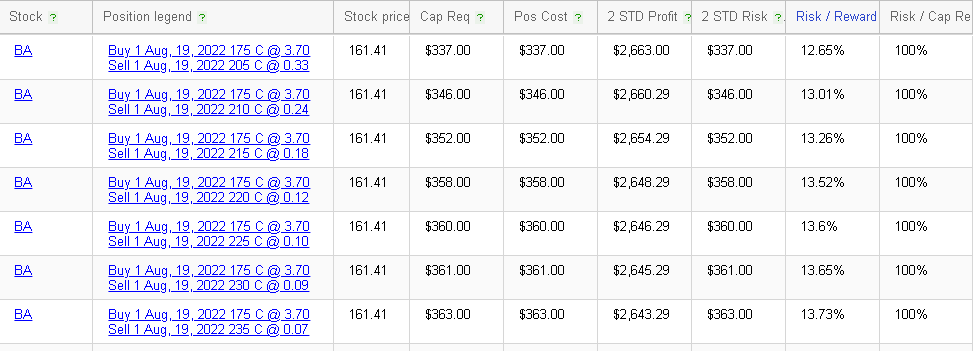
The most attractive structure displayed is the 175/205 bull vertical spread costing $337 for a potential profit of $2.66k.
If you need help setting up some scans with the RT Spread Scanner, do not hesitate to reach out to our support@ivolatility.com