Unchanged but a lot really happened
July 15, 2022
Yesterday’s session very much resembled Wednesday with bears taking advantage of the low volume overnight session to press shorts and take the market lower. We attacked the open around the key 3740-3750 support and a few prints below were sufficient to trigger the stops hidden below. ES quickly traded to 3724 but the selling pressure rapidly abated once stops were cleared and the market moved back above 3740 by 11.25am. From there, bulls took control of the session and got prices back towards 3800. The SPX settled 0.3% lower, the NDX 0.34% higher and the DJIA 0.46% lower.
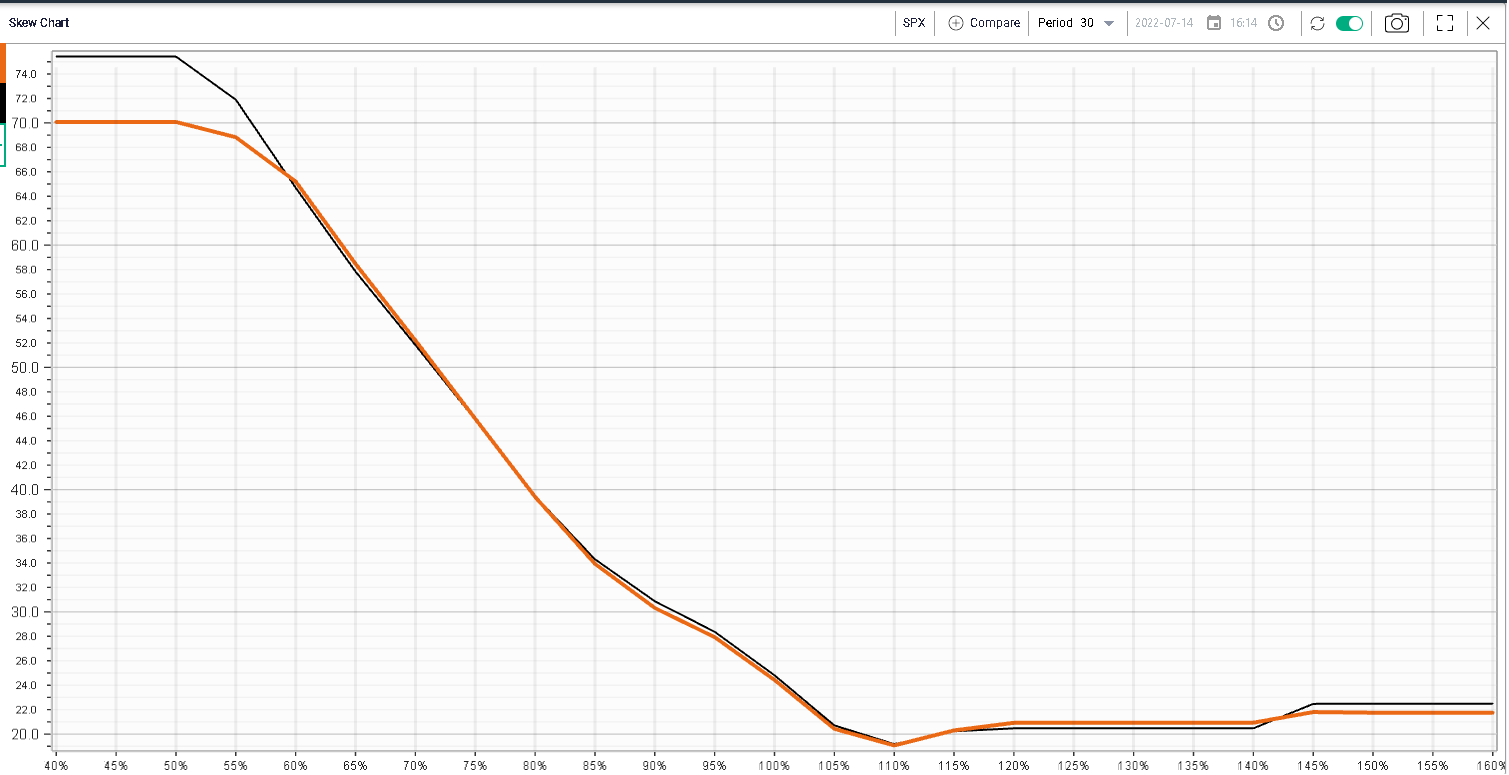
Implied volatilities were largely unchanged over the session as shown on the below 30d skew curve with in orange Thursday’s closing values and in black the skew as of Wednesday.

Despite the index showing a very similar performance and price action on Wednesday and Thursday, underlying sectorial performances were very different.
Financials struggled with the sector losing almost 2% on the day, brining the 2022 performance to negative 22.2%. JPM was a notable laggard losing 3.5% as the company reported a more conservative set of numbers than anticipated. In particular, media reports focused on the build-up of reserves and the fact that JPM has temporarily stopped its share repurchases. Morgan Stanley also reported earnings but the company finished almost unchanged on the day despite missing numbers.
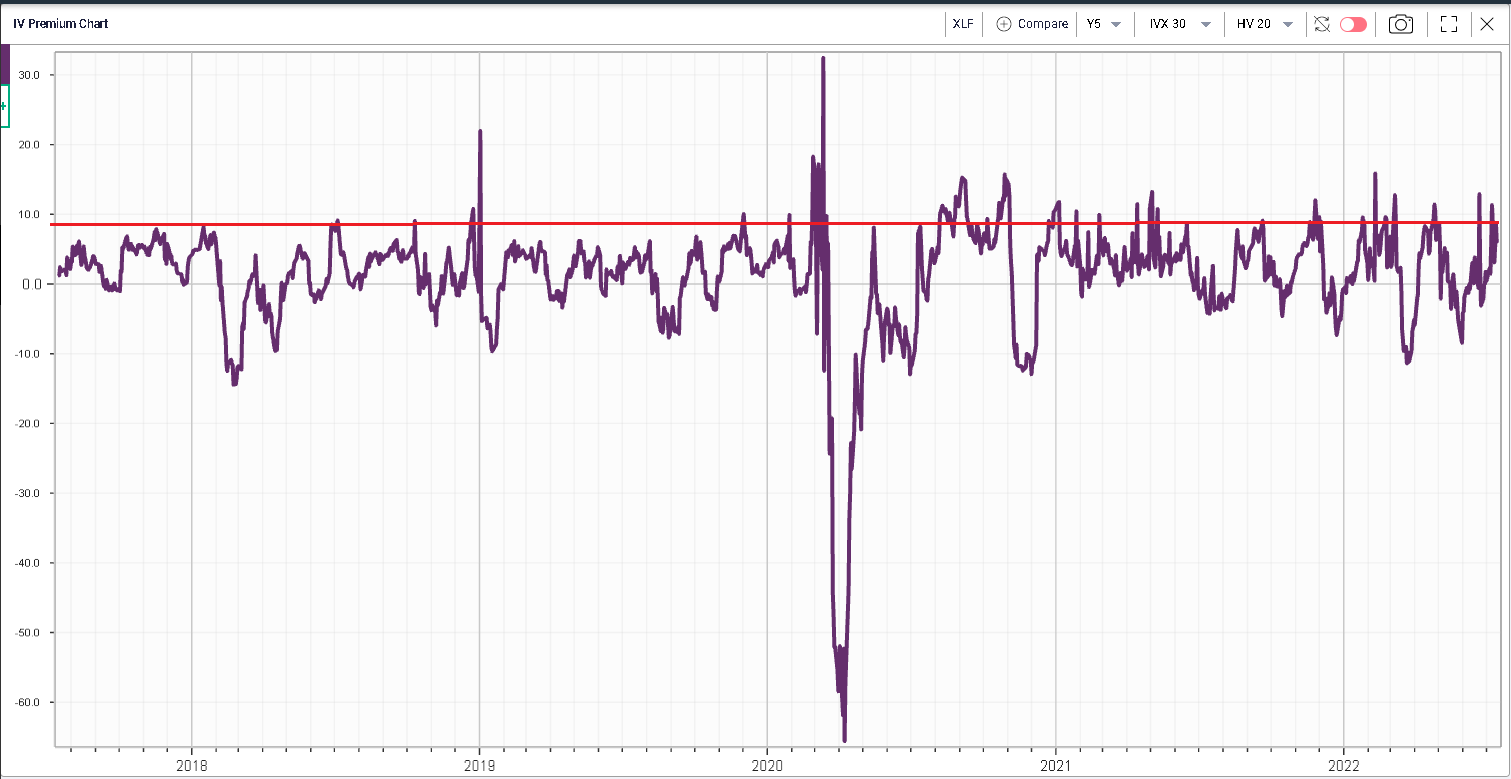
Looking at the XLF IV Premium (30d/20d), we highlight on the below chart the current position relative to the last 5 years of history in red. From that perspective, the implied volatility of the XLF looks relatively elevated.

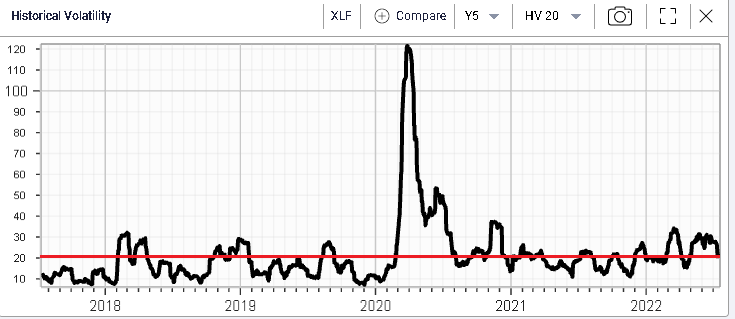
This is driven by the realized volatility of the sector which, despite yesterday’s move, has remained fairly low overall in 2022 hitting the 20% mark recently when measured over the last 20 days.

The energy space yesterday from another weak component losing 1.9% at the sector level. Note that the year-to-date performance of the XLE is now “onlyâ€