Market News & Research June 14, 2022 CPI & QT Twofer |
The Federal Reserve began reducing liquidity from the monetary system on June 1 by not replacing a limited amount maturing securities in its mammoth portfolio, commonly called QT. Then the global financial system received unwelcomed news on Friday that the widely watched Consumer Price Index increased at an annual 8.6% rate, disappointing those expecting it to drop. Interestingly equities in general and the S&P 500 Index specifically headed lower on Thursday afternoon ahead of the report. This special Monday version includes results from last week. |
The next downleg now underway began late last Thursday when suddenly the markets collectively realized that the CPI report scheduled for early Friday morning would likely be higher than previously expected. With gasoline prices rising for the entire month of May only those with EVs or don't drive to work could believe that inflation had already peaked. Leaked data seems like a more credible explanation for Thursday's decline that began around 2:30 in the afternoon. Until then, the technicals remained positive as the 50-day Moving Average loomed above as the target for the counter -trend bounce. Typically, stampedes don't start without something setting them off, like a gunshot or lightning. Something set off a stampede for the exit last Thursday afternoon, perhaps leaked CPI data. |
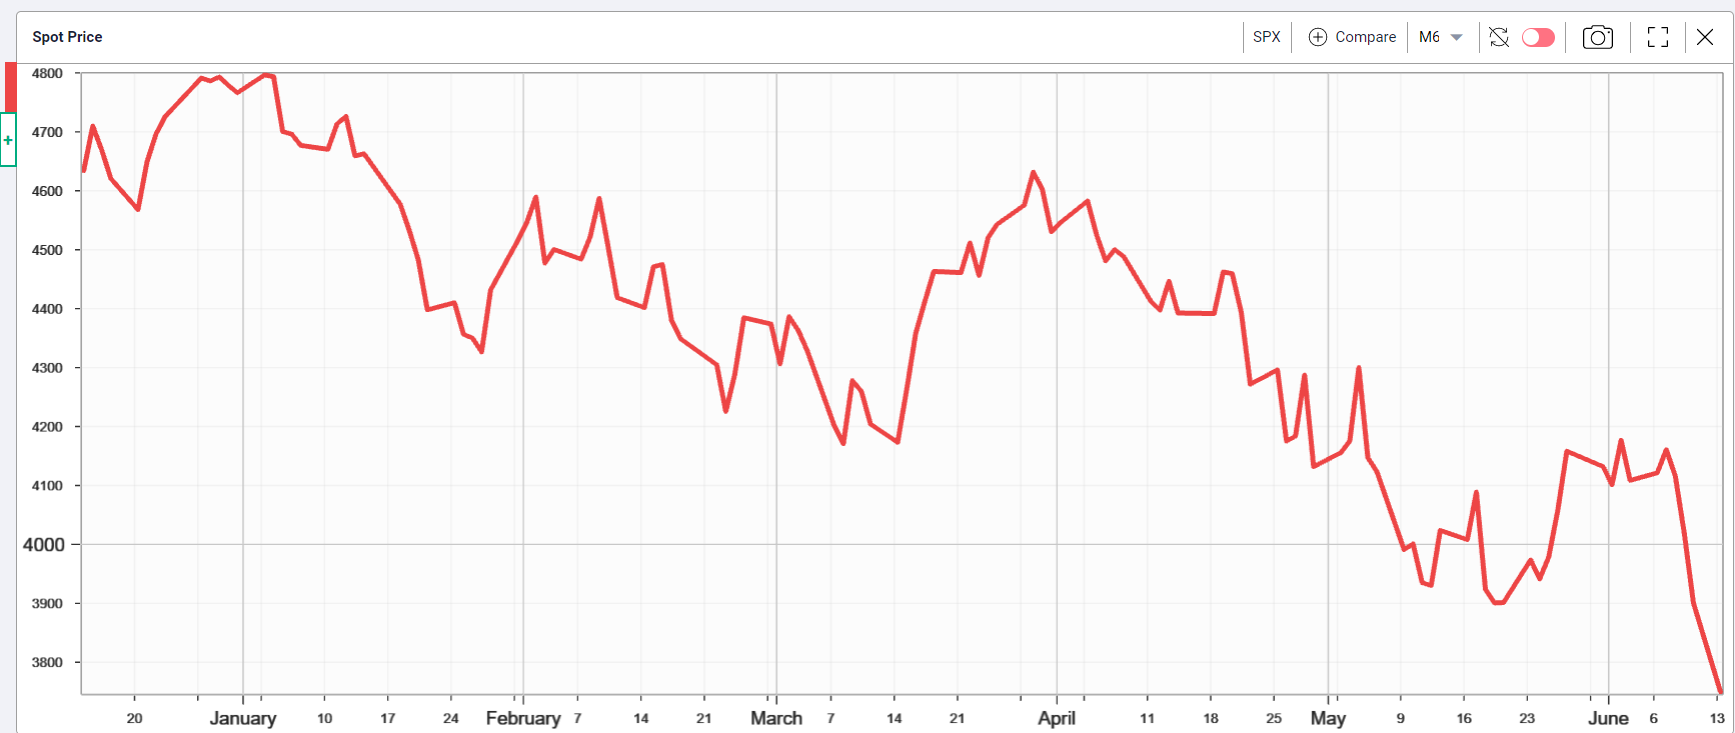
S&P 500 Index (SPX) 3749.63 dropped 358.91 points or -8.94% in the last 6 trading days closing Monday well below the prior low at the May 10 low of 3810.32 when it made a the late day reversal setting off the last counter-trend bounce as expectations of the bounce then underway could continue up to test the 50-day Moving Average at 4242.85. The apparent front running of the CPI report last Thursday ended that bounce. |
Monday's 151.23 point or -3.88% decline on increased volume of 3.0 bn shares closed well below the May 20 low with internal indicators such as Advance-Decline Volume, New Highs minus New Lows, and the NYSE Advance Decline Ratio all made their respective lows for the year. |
It's no surprise the driving force came from rising interest rates as the yield on the U.S. 10-Year Treasury Note gained 28 basis points to end at 3.43% while the 2-Year Note added 36 basis points ending at 3.40% as the 10-2 curve flattened to just 3 basis points. |
Although the requirement to increase interest rates in an effort to slow inflation pushed equities lower, the upcoming FOMC meeting along with Jerome Powell's comments on Wednesday could also help stem the tide and even set off another counter-trend bounce presuming they announce a more aggressive rate hike plan to demonstrate they really do understand the severity of the problem. |
The SPX chart: |
|
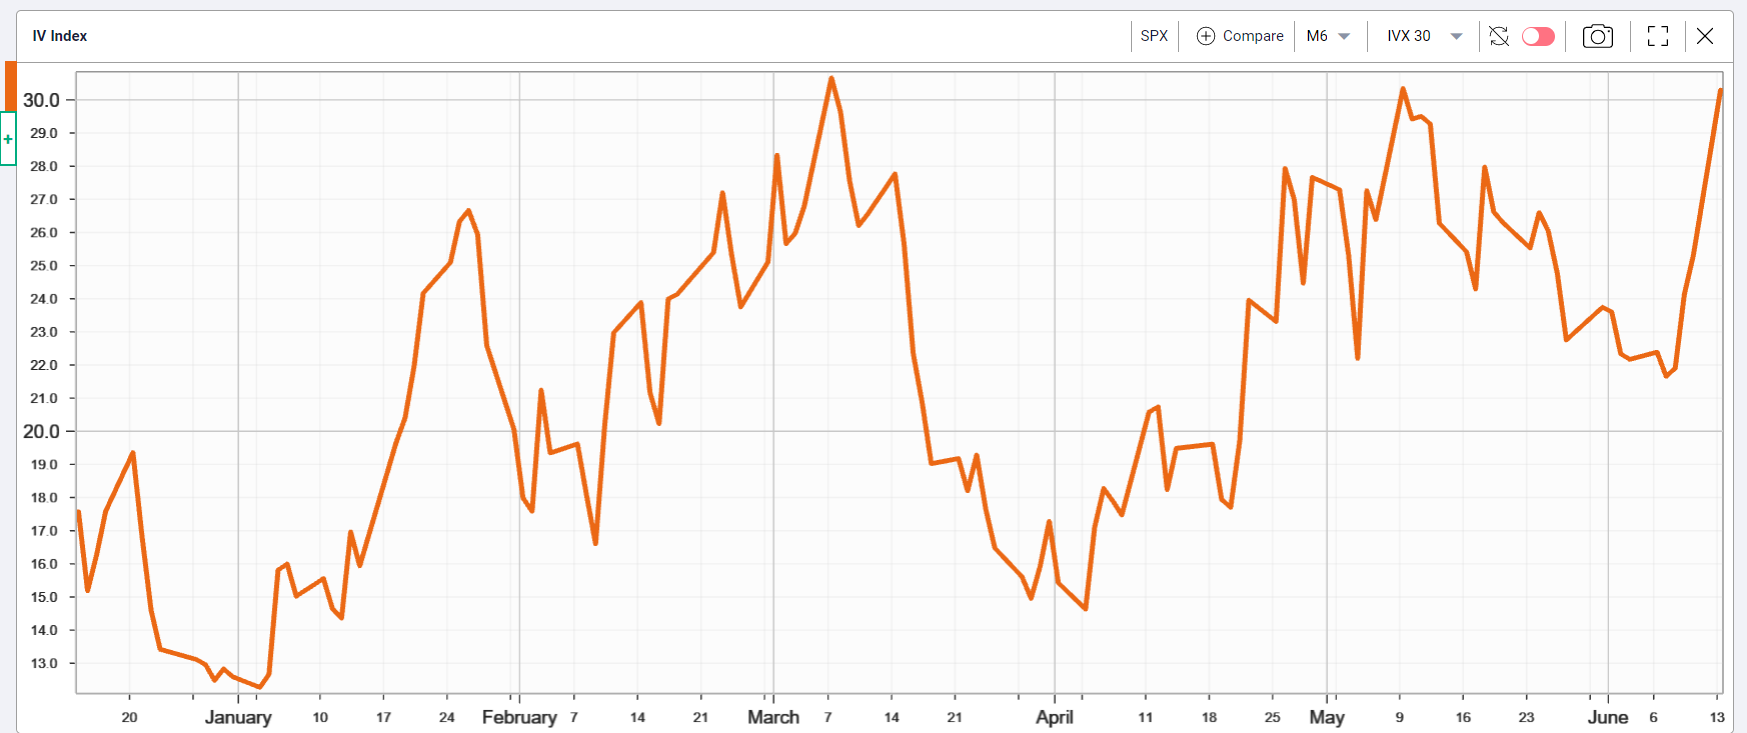
From the perspective of the SPX options market, implied volatility turned higher Thursday and continue advancing. On Monday it gained 4.99 or 19.70% to end at 30.30%Â as shown in the chart below. |
|

