Looking at TSLA's selloff |
Stocks resumed their selloff yesterday breaking through their recent lows with the NDX settling down 3%, the SPX down 1.65%and the DJIA down 1%. |
In yesterday’s market update, we discussed how volatility had been lagging spot over the recent days and gave an explanation. If you would like to see older market updates, please visit: https://www.ivolatility.com/news.j |
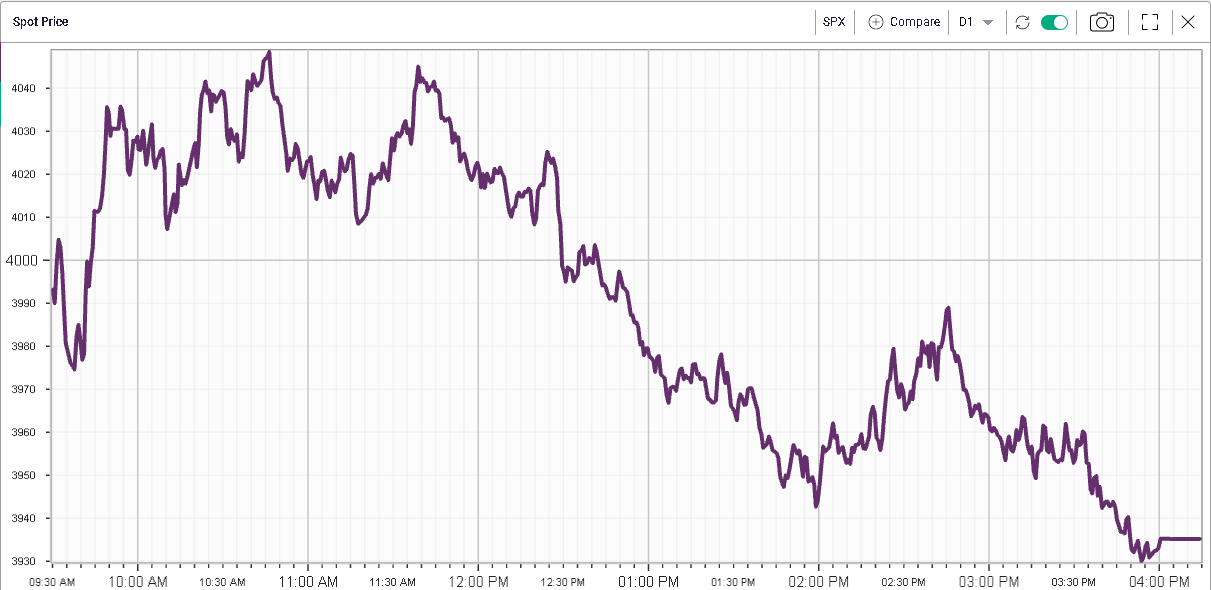
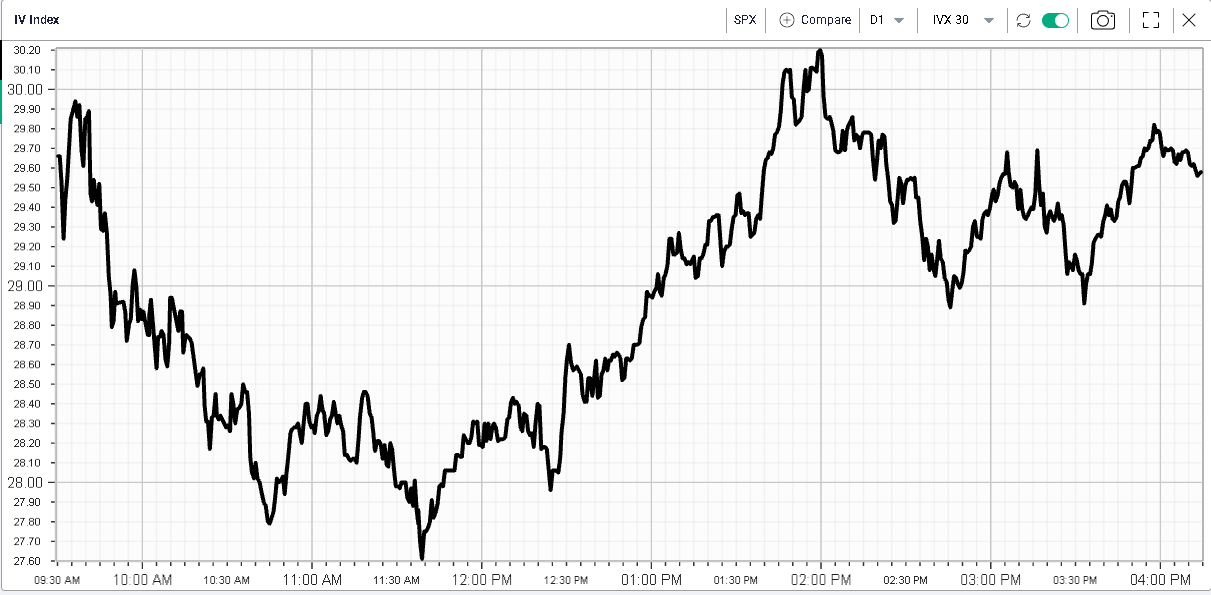
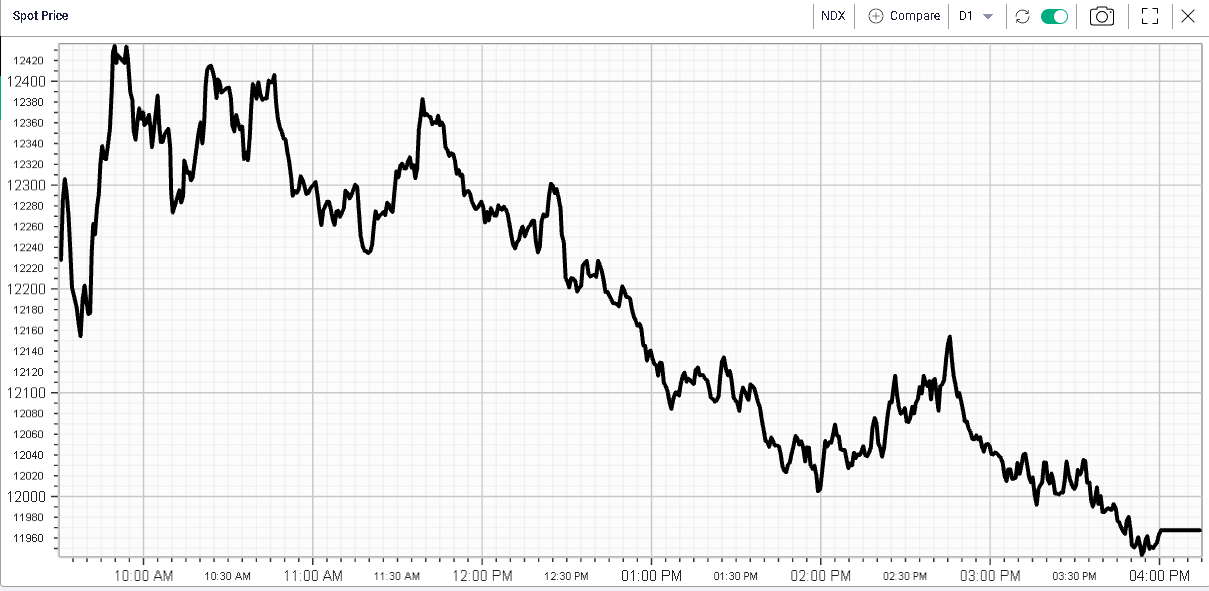
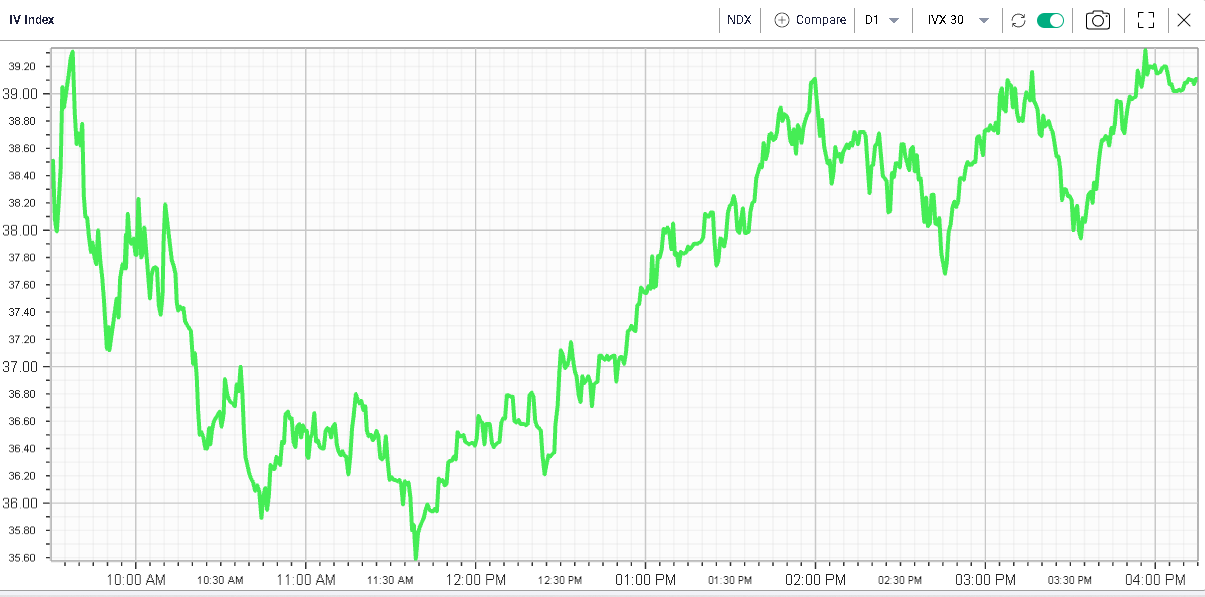
Yesterday once again saw volatility underperform despite stocks selling off as shown on the intraday charts below for SPX and NDX of both spot prices and 30d IDX with 1 minute timeframe. |
|
While the SPX finished on its lows, the 30d IVX closed around 50 bps from its day’s highs. |
|
The same is true in the NDX although the 30d IVX finished at the highs slightly outperforming the 30d IVX for the SPX. |
|
|
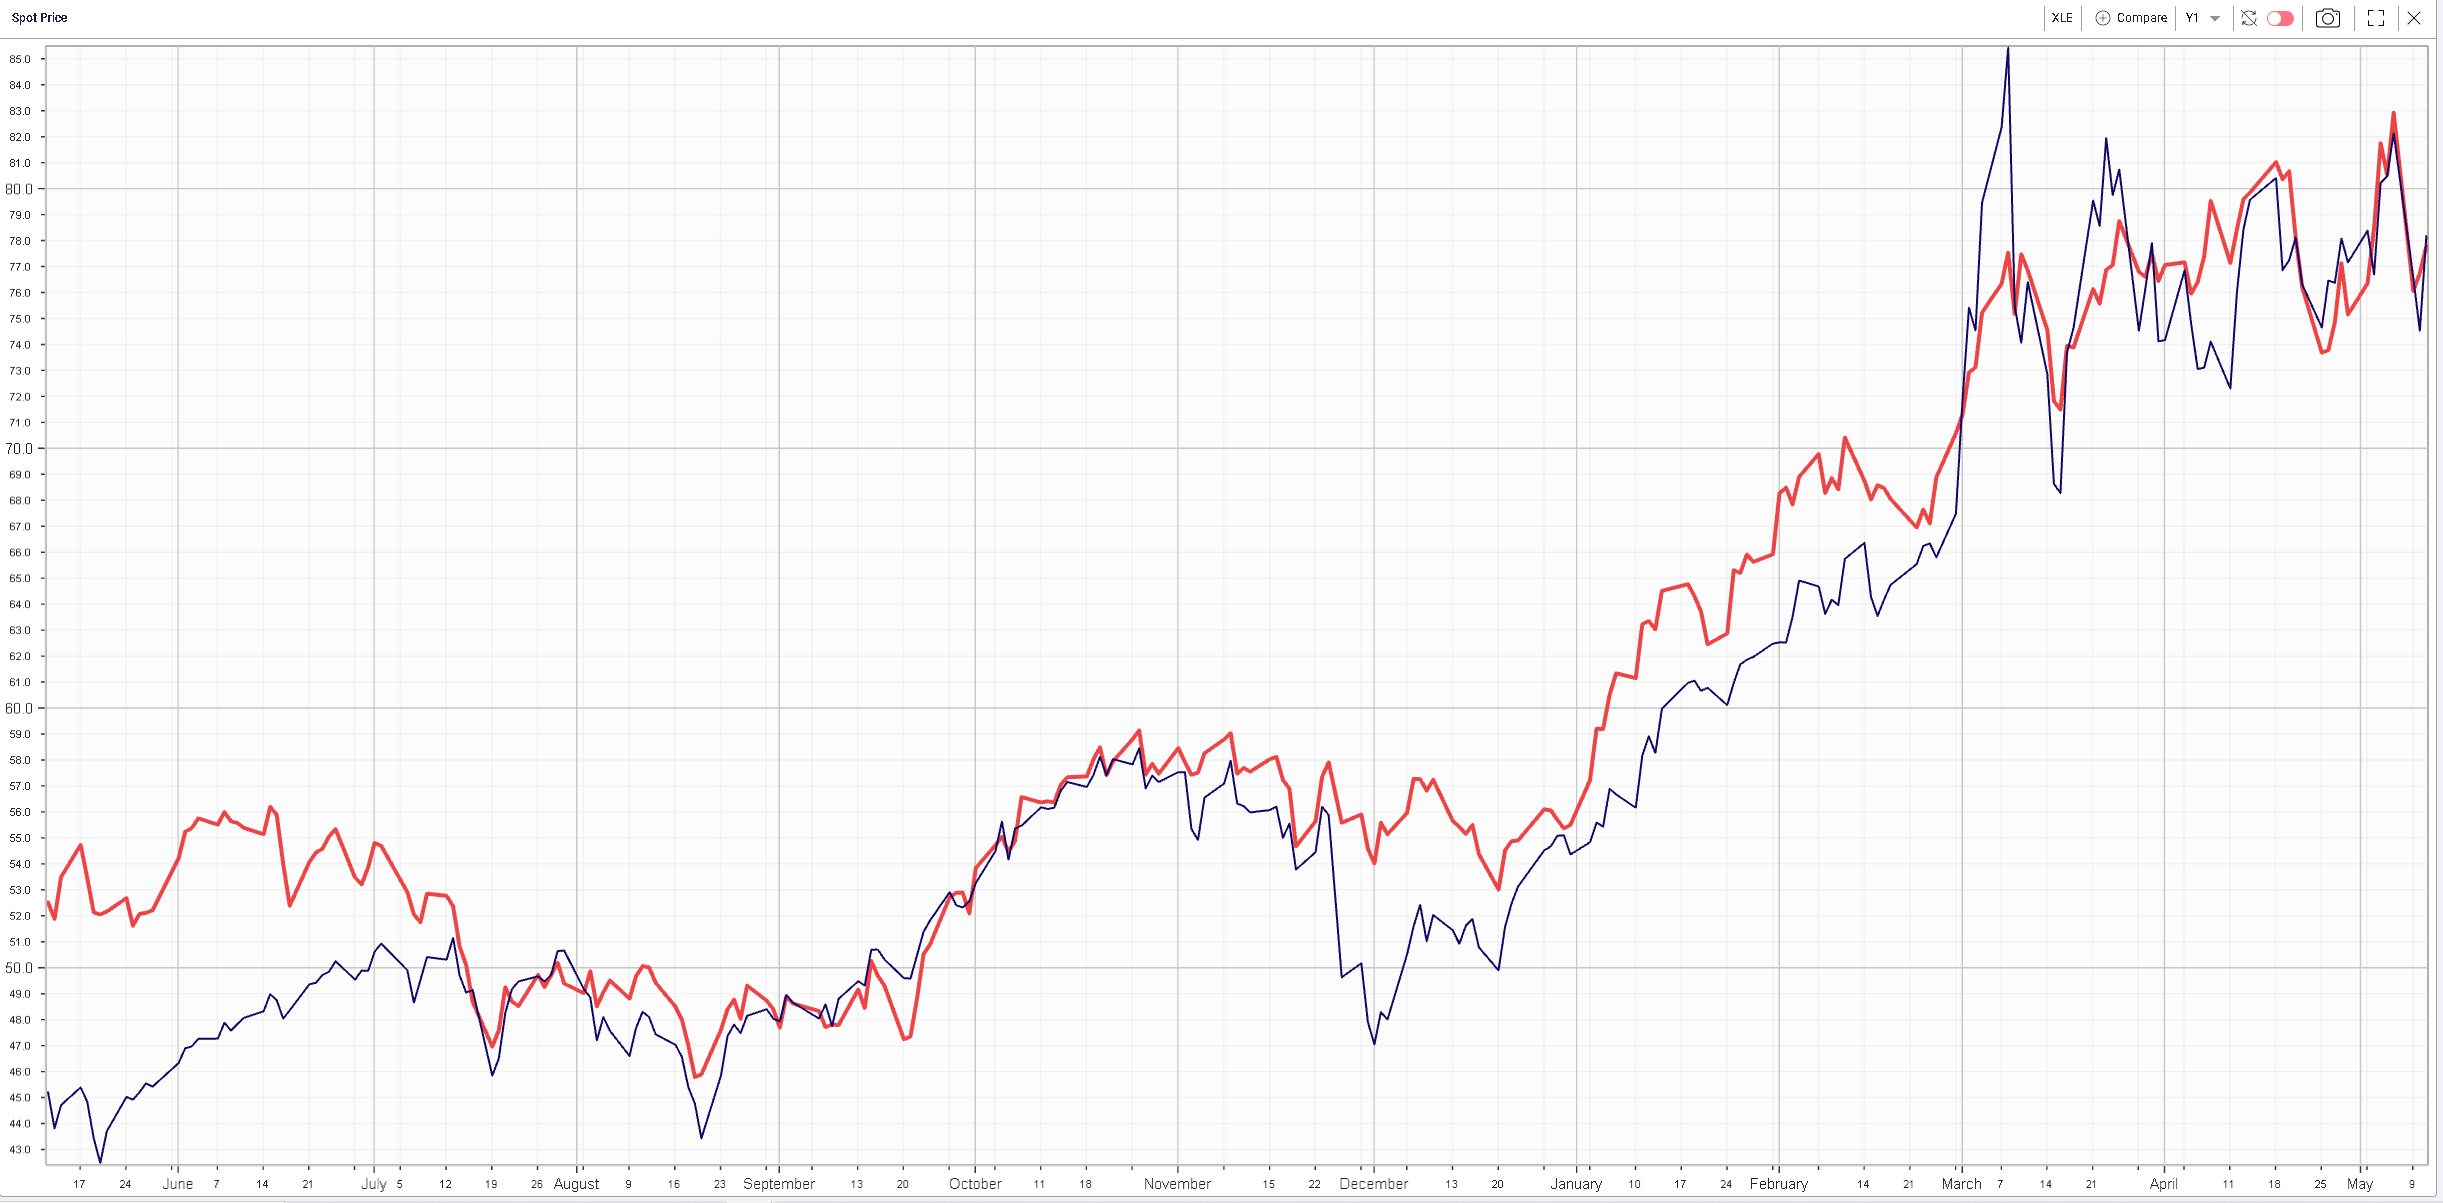
Looking at sectors, defensives outperformed with utilities up 0.7% on the day and materials unchanged. Energy also performed well up 1.3% and the sector continues to trade very much in line with Crude Oil as shown below. |
|
On the downside, Consumer Discretionary stocks continue to underperform closing 3.6% alongside Technology stocks which finished 3.16% lower yesterday. |
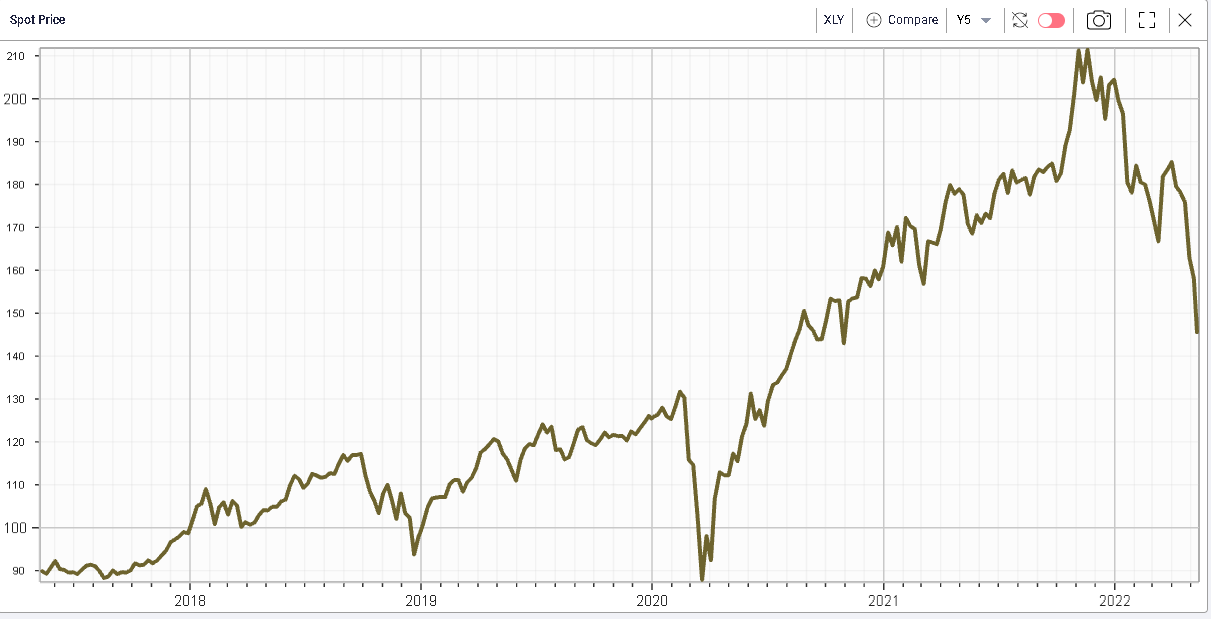
Consumer Discretionary stocks have been sold very aggressively and are down around 31% from their 12 months highs. The space is still up 62% over the past 5 years and the selling is now almost as large as what was seen when the pandemic broke out. |
|
Two stocks make up almost 40% of the index, TSLA and AMZN with around 20% weight each in the sector. |
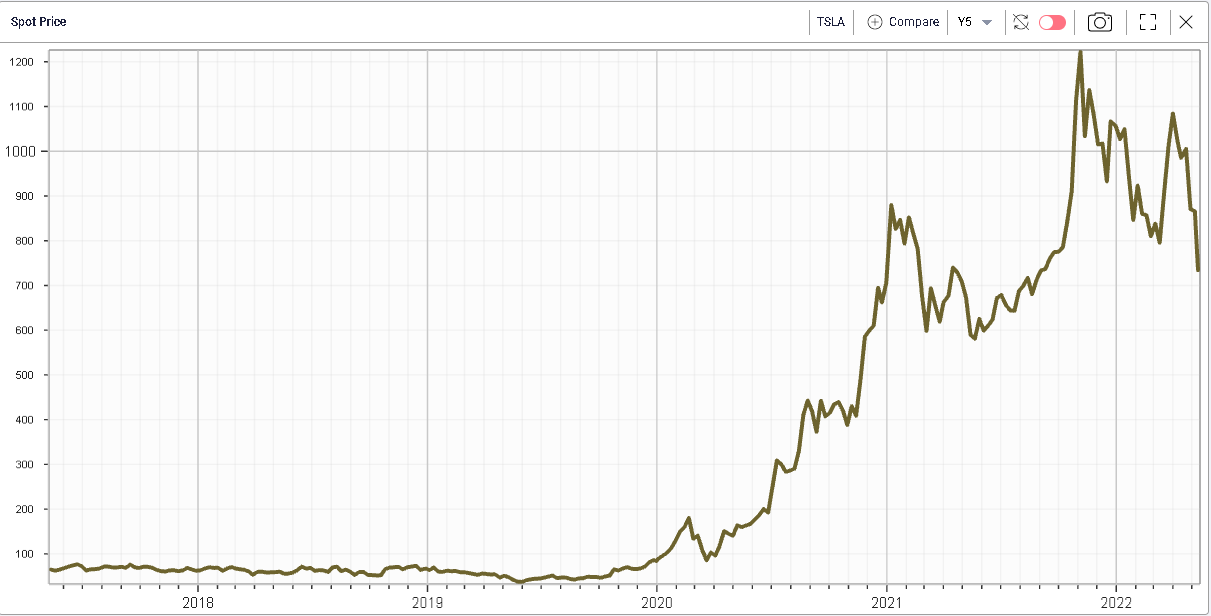
TSLA finished around 8.25% lower yesterday and is now down almost 40% on the year. Looking over 5 years, the performance remains a very comfortable 1,030%. |
|
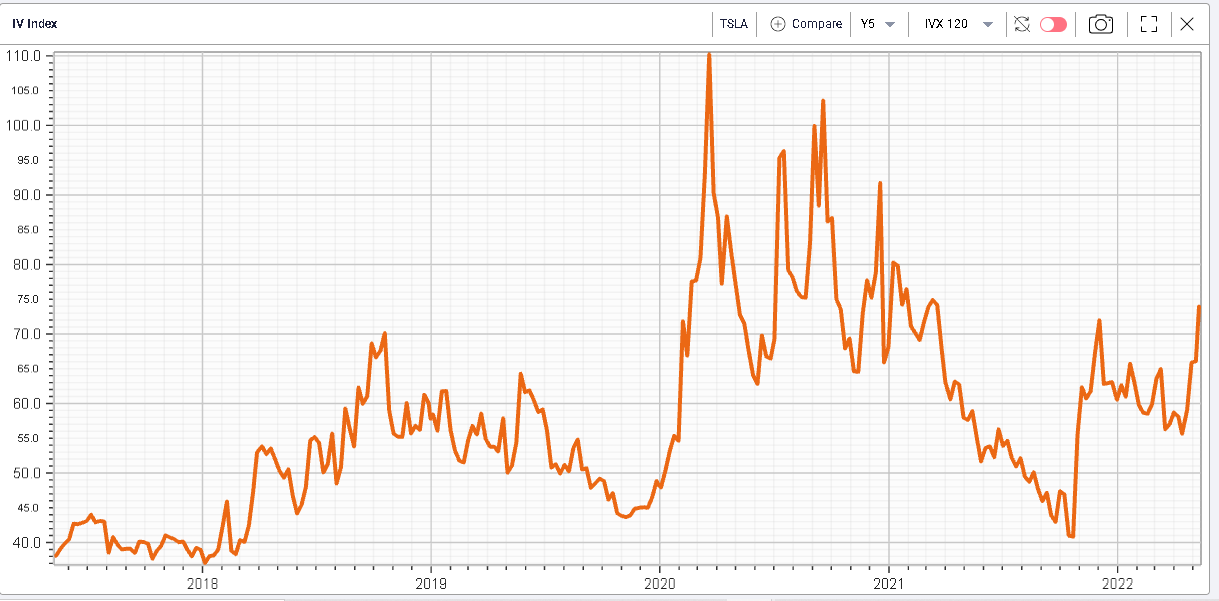
TSLA 120d IVX is trading around 75 which is around the middle of the range for that stock. |
|
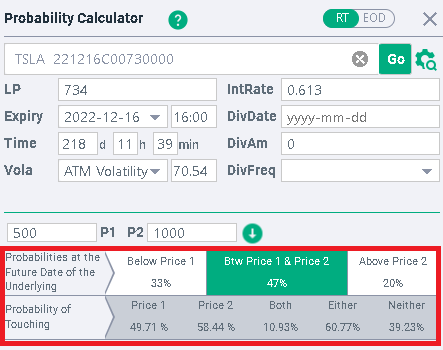
Looking at the probability calculator, we are able to infer from options prices the probabilities that the stock will for instance finish below $500 by the December expiration or finish above $1,000 by then. |
|
As of last night’s close, options prices were assigning a 20% probability that TSLA would finish above $1,000 on the 16th Dec’22. As per our calculations the probability that the stock would finish below $500 by the 16th Dec’22 was evaluated at around 33%. |
Very importantly, the probability calculator tells us that there is around 50% that at any point in time between today and the 16th Dec’22 TSLA will trade $500. There is also 58% chance of touching $1,000 between now and the expiration. |
Those tools can be very useful when preparing a trade as they allow to convert option pricing and theoretical models into theoretical probabilities. Those might be easier to comprehend and traders might use those to calibrate their positions and understand their risks a bit better. |
For instance, a trader who wants to sell the $500 - $1,000 strangle in TSLA will probably find it interesting to know that the market is assigning around 47% chance that he will finish between those two strikes in December and only 39% that the stock does not trade $500 or $1,000 between now and the 16th Dec’22. |
Disclaimer - This information is provided for general information and marketing purposes only. The content of the presentation does not constitute investment advice or a recommendation. IVolatility.com and its partners do not guarantee that this information is error free. The data shown in this presentation are not necessarily real time data. IVolatility.com and its partners will not be liable for any loss or damage, including without limitation, any loss of profit, which may arise directly or indirectly from the use or reliance on the information. When trading, you should consider whether you can afford to take the high risk of losing your money. You should not make decisions that are only based on the information provided in this video. Please be aware that information and research based on historical data or performance do not guarantee future performance or results. Past performance is not necessarily indicative of future results, and any person acting on this information does so entirely at their own risk. |
