Do not ignore boring stocks! |
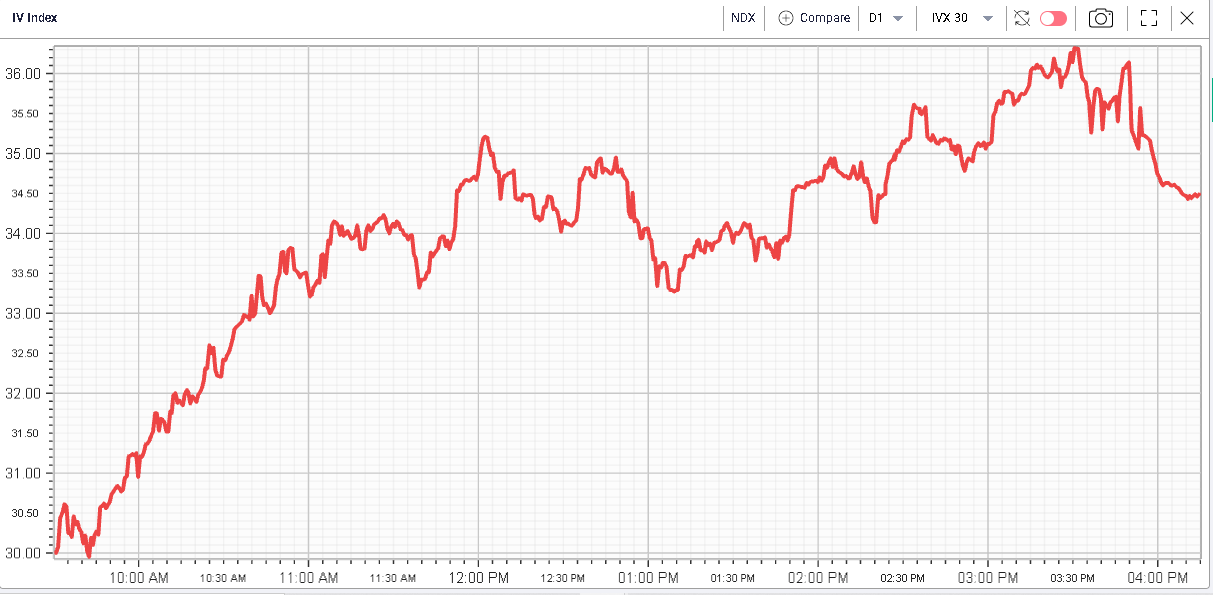
After Thursday’s turnaround and aggressive selloff, the SP X and the DJIA held their ground and finished down respectively 0.6% and 0.3%. The NDX saw a bit more selling finishing 1.2% lower on the day. |
Overall, markets moved a lot each day but overall, little happened in a continuation of a theme that we highlighted in a previous market update. Over the past 5 trading sessions, the SPX is down 0.2%, the NDX is 1.3% lower and the DJIA is 0.24% lower. |
This creates a market that favors active traders who can navigate tumultuous markets and book profits and losses rapidly. This is in stark contrast to what had prevailed for the past few years where dip buyers were encouraged to hold on to their positions at least until new highs were established. |
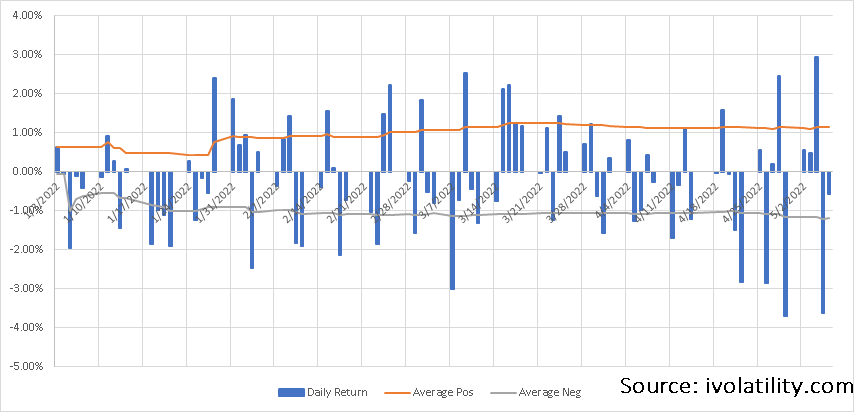
The chart below, produced with Ivolatility.com data shows the daily returns in 2022 with the average positive return in 2022 in orange and average positive returns in 2022 in grey. |
|
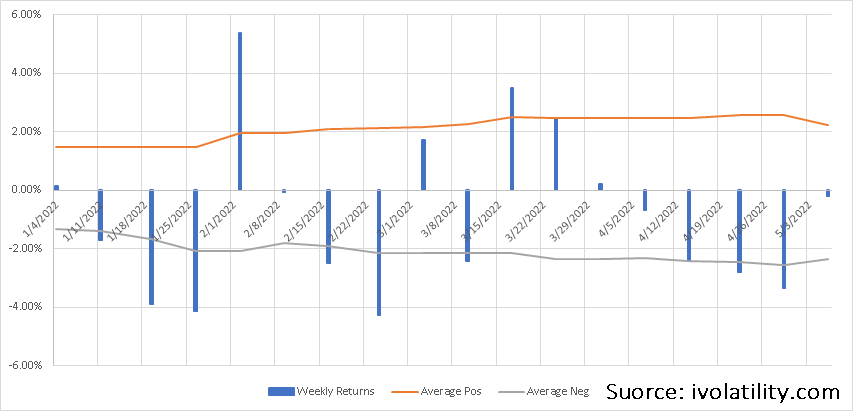
The chart below shows the same information but on a weekly basis. |
|
Looking at the daily chart, we see that there have been several large daily reversals that occurred in the past few weeks with a large upswing being followed by a large downswing. On the weekly chart however, the trend is a lot clearer with the last 5 weeks showing a negative result. |
The overall picture that it paints is one of nervous shorts that remain in control but seem very worried about a possible reversal in the market. This is not surprising considering how the buy the dip mentality has dominated over the past decade. |
This leaves traders with highly aggressive short covering sessions that are then reversed once the impulse disappears as we saw on Wednesday/Thursday last week for example. |
On Friday it was worth noticing the renewed weakness in Chinese Equities with the HSCEI closing 4.3% lower as the government confirmed its resolve on the zero Covid policy raising fears that more restrictions could come if the situation does not improve. |
|
Looking at sector performance, the Communication sector continued to struggle closing 2.2% lower on the day. FB finished 2% lower and NFLX finished almost 4% lower. Materials were also sold closing 1.4% lower on the day with names like FCX finishing 4.4% lower. |
On the upside, Energy continued to rally and finished 3% higher. The space is now up 45% on the year and was led on Friday by names like CVX up 2.7%, EOG up 7% or even COP up 4.7%. |
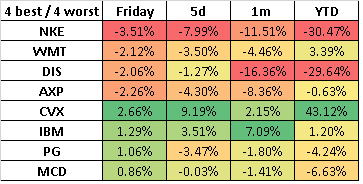
Looking at the DJIA components as we frequently do in the market update, we zoom on the 4 best performers and 4 worst performers on Friday: |
|
First, the year to date should tell us more about how the market perceives those stocks. There are three categories, the winners, those that benefit from the current situation. This is the case of CVX up more than 40% on the year. Second category is made up of the losers, those that are most negatively impacted by the situation. This is the case for NKE and DIS. Finally, the other names can be considered as neutral to the situation, it is the names that are largely unchanged. |
Being neutral to a specific type of shock can be considered a trait of a defensive stock. In such market conditions, being indifferent to a situation is a key strength for those stocks. We are not saying that traders are not interested in owning names that go up and in avoiding those that go down but rather that it may make sense to limit the overall portfolio exposure to a specific shock or event that has hit the market except when this is specifically what the trade wants to play. |
If a stock went up a lot on the back of a specific development and the trader decides to buy it then the trader is exposed to the risk that the event reverses and as a result that the performance is unwound. On the other hand, buying a stock that has been negatively affected can result in a prolonged underperformance in the event of a continuation of the trend. |
Stocks that have shown to be neutral to the situation can be evaluated for their own intrinsic properties which should be the first goal of anyone involved in stock trading while for the other names, any analysis will have to be far more conservative and include assumptions and scenarios on the main macro event that hit the market. |
One of the advantages shown by stocks insulated from a specific macro risk is that their volatility will be far lower than that of the rest of the market. As volatility is usually a way to evaluate risk, it allows traders to reduce their risk while remaining invested in the market. |
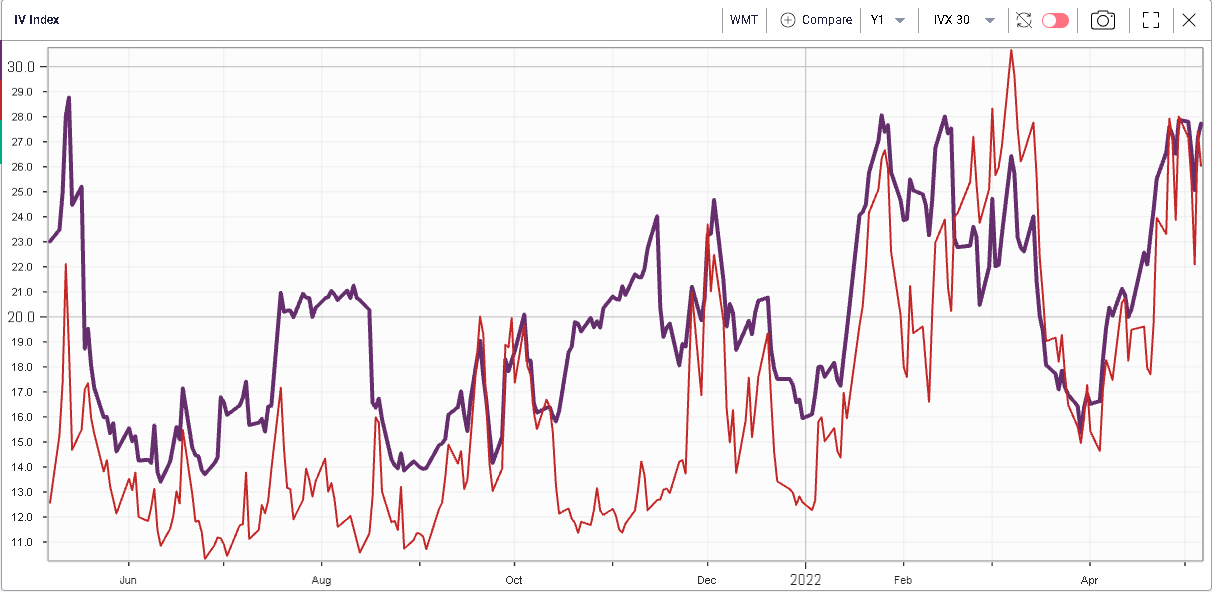
For instance, taking WMT as an example, we can see how its implied volatility has remained subdued and has actually compressed when compared to the SPX. |
30d IVX for WMT in blue and SPX in red |
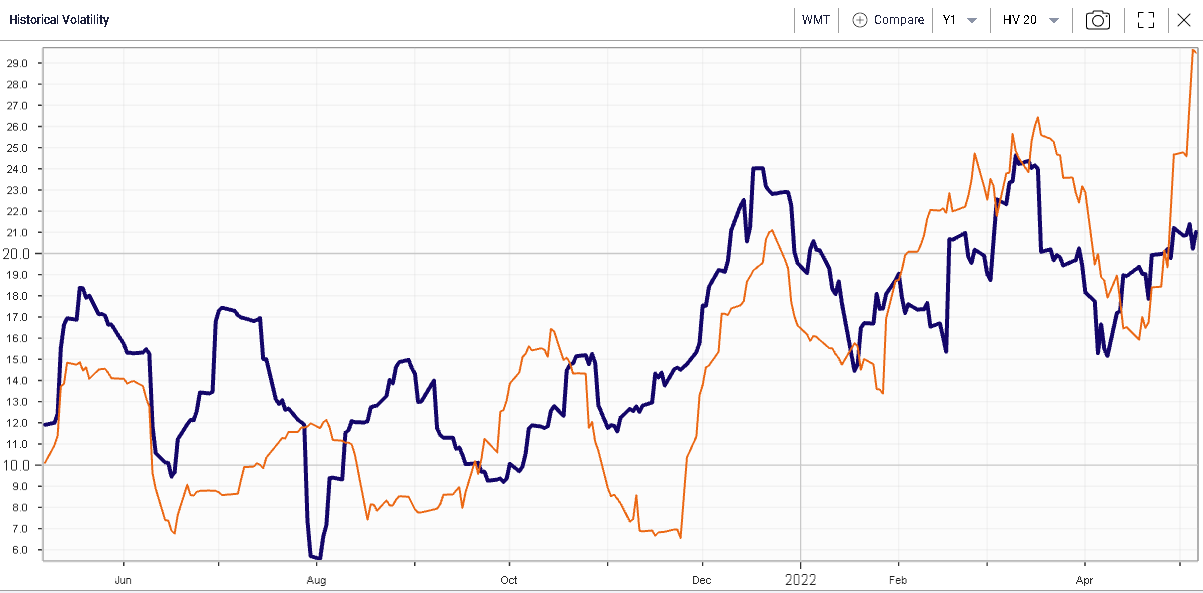
The same can be said about realized volatility where WMT is now seen to realize significantly less than the SPX. |
20d HV for WMT in Blue and SPX in orange |
It is also interesting to note how the implied volatility has been dragged higher while the realized has remained subdued. This is generally explained by an unwillingness by options traders to sell options with volatilities that may look optically low. This psychological bias is fairly obvious but can create opportunities for traders who have studied the company and are comfortable selling volatility. |
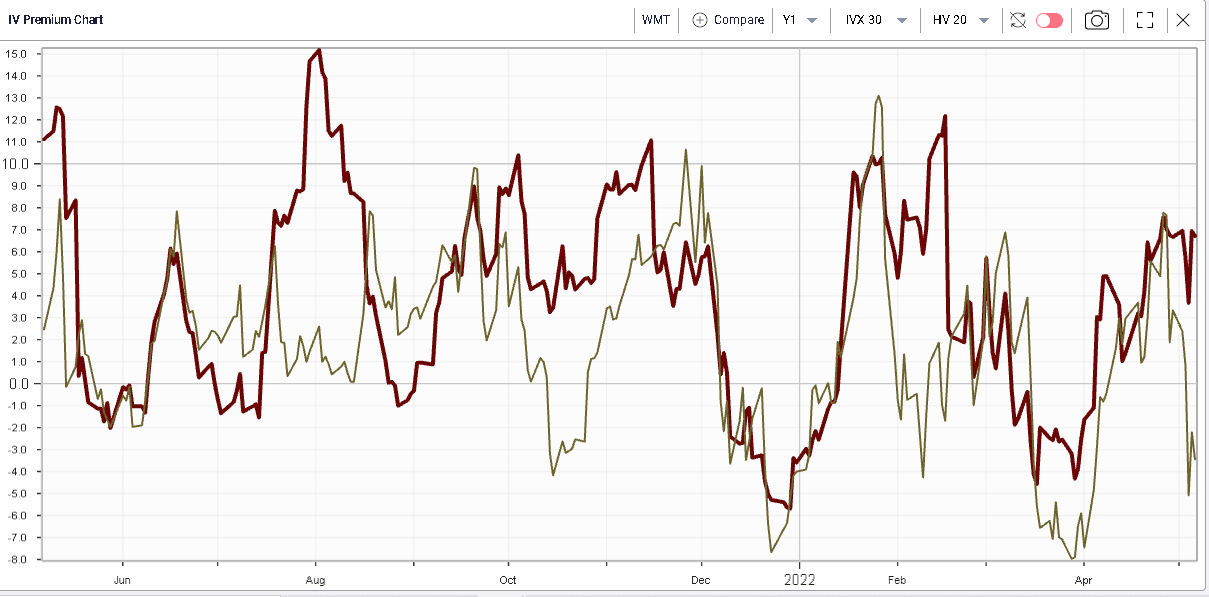
Below, we show the 30d/20d Implied Volatility Premium on WMT and the SPX. We can see how the IV Premium has turned negative for the SPX as realized volatility increased but has stayed elevated for WMT as the stock has failed to move |
30d/20d IV Premium - WMT in red, SPX in yellow |
Does it mean that you should sell outright options in WMT? We cannot tell and it would require further analysis to understand this point, for instance assessing whether some events in the near future might impact the name. Earnings releases are probably the first things to check and WMT is expected to release figures on the 17th May’22. |
If you decide to sell options because you think volatility is rich, you should also consider the various possibilities at your disposal. Selling a naked put or call is not always the best strategy and our RT Spread can help you decide. |
In this particular case, let us imagine that a trader thinks that the stock will remain relatively calm over the next few months and wants to express that view. A starting point could be to sell a straddle but that would mean assuming an unlimited amount of risk in case the trader is wrong. |
Using spreads can offer an attractive alternative and allow the trader to know precisely the amount of risk taken for each unit of possible gain. Selling bear vertical spreads allows the trader to gain should the stock trade sideways or up, selling bull vertical spreads allows the trader to gain should the stock trade sideways or down. Selling both is a play on the market trading sideways with a wider margin for error. |
Using the RT Spread Scanner allows traders to find the most attractive strategies based on their set of criteria. For instance, below we show some examples of bear vertical spreads ranked by Risk/Reward. |
|
One combination of bull vertical spread is also highlighted below: |
|
Disclaimer - This information is provided for general information and marketing purposes only. The content of the presentation does not constitute investment advice or a recommendation. IVolatility.com and its partners do not guarantee that this information is error free. The data shown in this presentation are not necessarily real time data. IVolatility.com and its partners will not be liable for any loss or damage, including without limitation, any loss of profit, which may arise directly or indirectly from the use or reliance on the information. When trading, you should consider whether you can afford to take the high risk of losing your money. You should not make decisions that are only based on the information provided in this video. Please be aware that information and research based on historical data or performance do not guarantee future performance or results. Past performance is not necessarily indicative of future results, and any person acting on this information does so entirely at their own risk. |
