We offer multiple professional grade services to help you gain insight on volatility trading. Do not hesitate to try our products FOR FREE by clicking HERE |
The Market Update is a daily newsletter written by the team at iVolatility.com. Leveraging our analytics and data we are able to update you on key developments in the volatility market. To receive the Market Update directly into your inbox, please open a free account or visit our SITE where it is published every day. |
Market Update: 2022-03-15 |
High volatility remains the dominant theme to start this week with US indices under pressure on Monday. European indices seemed to continue to bounce while Chinese stocks collapsed overnight. |
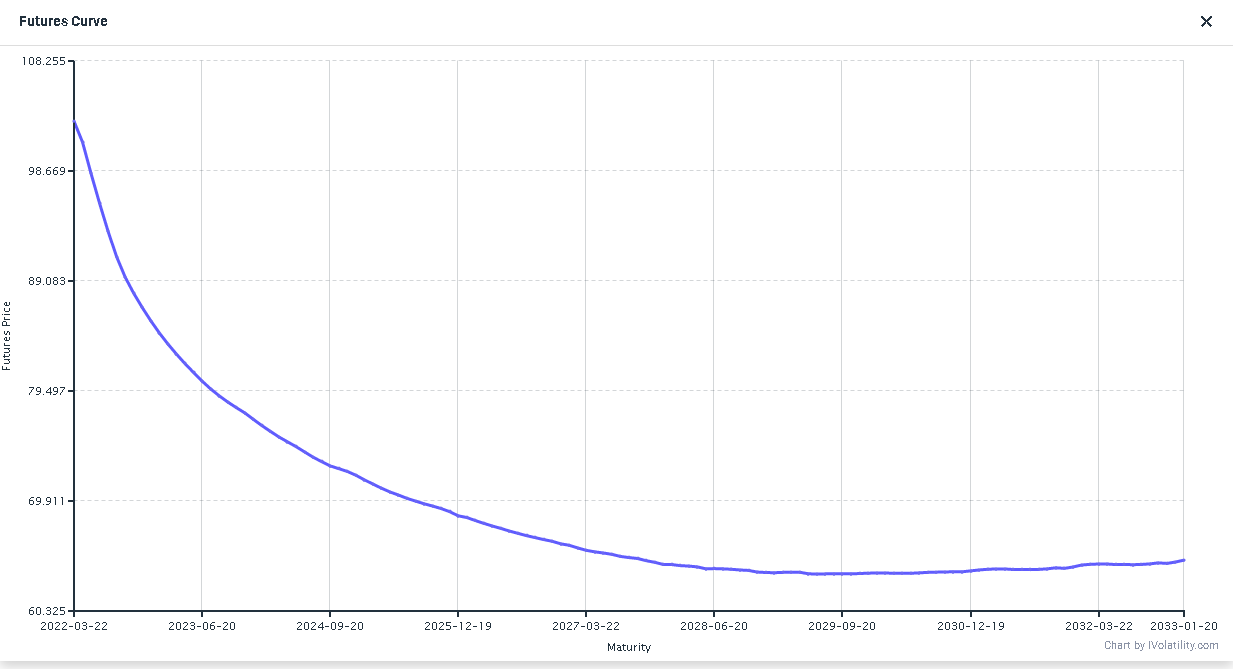
Considering that most of our readers follow the price action in the energy space and that energy stocks seem to act as a proxy trade for oil at the moment, it is worth noting that WTI is now back below $100. Furthermore, the backwardation in the curve remains quite steep with the Spot/June spread at around $8 and Spot/Dec at $17. |
|
To some degree, one could think that the curve is pricing some form of normalization over the next few months which could indicate a reduction in volatility as things settle down on the commodities front. |
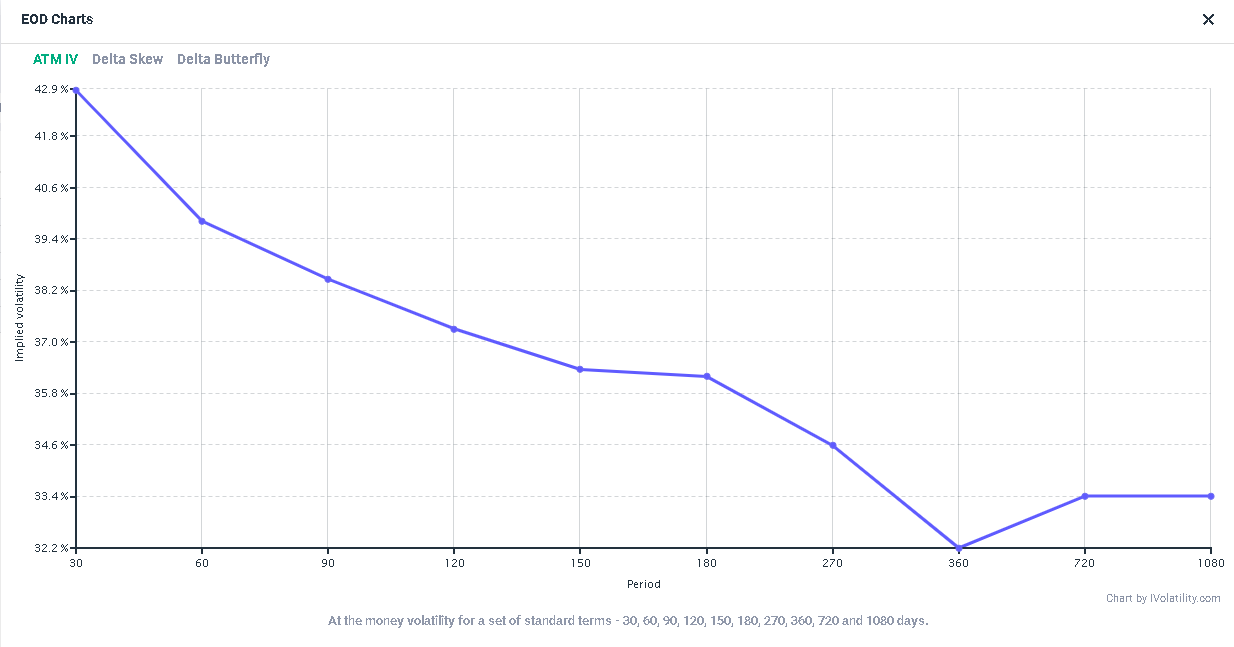
Looking at the term structure for the XLE, we can see that it is also inverted, essentially confirming an expectation that volatility could revert back to lower levels over the next few months. |
|
Looking at CVX, the stock traded down about 2.5% yesterday with 30d IVX finishing about 2 points lower. The price action divergence between the stock and crude oil over the last few days is also quite interesting. |
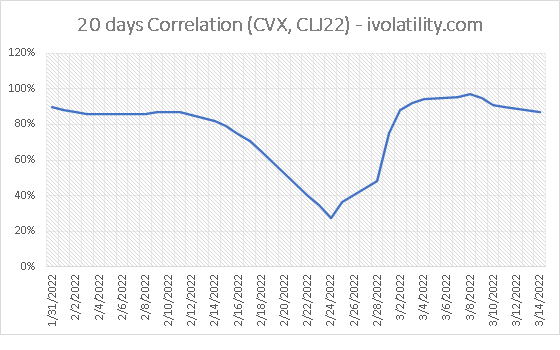
On the below charts created using data from ivolatility.com, we can see that CL and CVX were highly correlated as crude started to move higher. |
|
We can see that as the top in Oil was reached, both assets started to decorrelate. Looking at the 20 days realized correlation between them, it seems to have plateaued for now around elevated levels. |
|
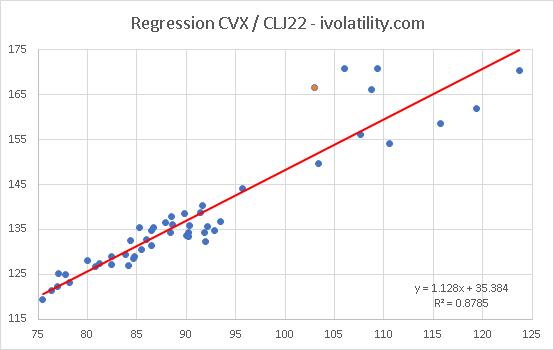
Finally, a quick linear regression shows not only that the vast majority of the recent moves in CVX can be explained by the changes in oil spot but also that the most recent data point in orange stands out as shifting away from the previous relationship that existed because CVX and Oil. |
|
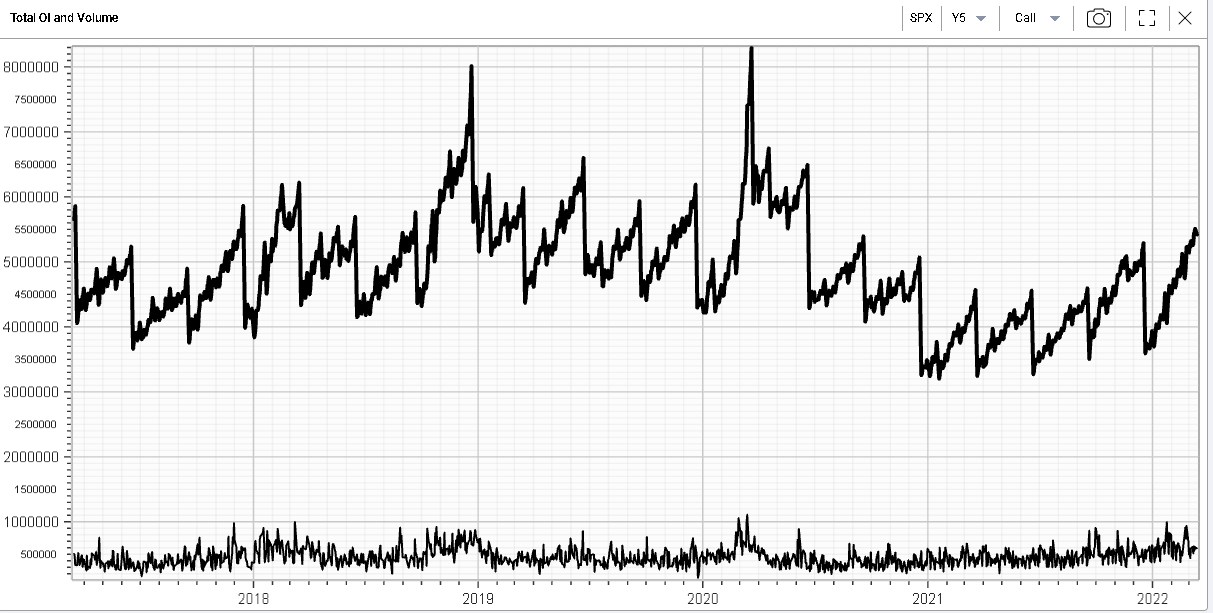
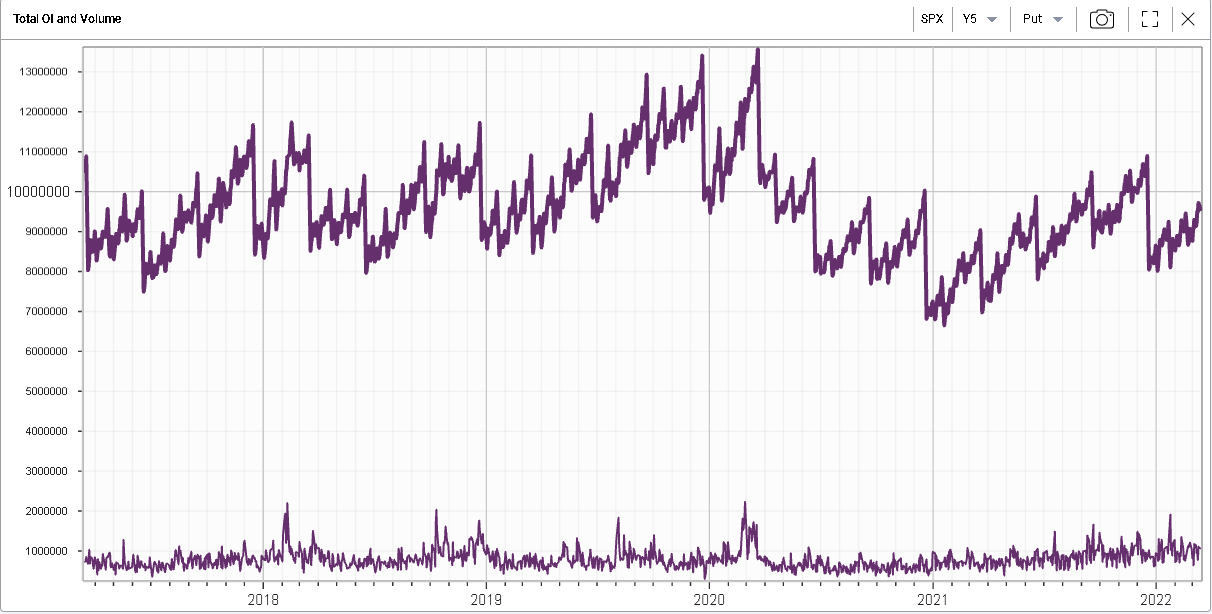
As we approach the March expiration on Friday, we will take a quick look at the open interest in the SPX. The first chart shows the OI and Volume for Calls on the SPX while the second one shows OI and Volume for SPX Puts over the last 5 years. |
|
|
We had noted in a previous market update that the call side had been traded intensely since the start of the year. We can see that the total outstanding open interest for the SPX on calls is already higher than the level it reached by in December. On the other hand, puts have been relatively out of favor for now. |
It will thus be interesting to understand several important points that might affect the moves both in spot and volatility for major indices and underliers over the next few weeks. |
|
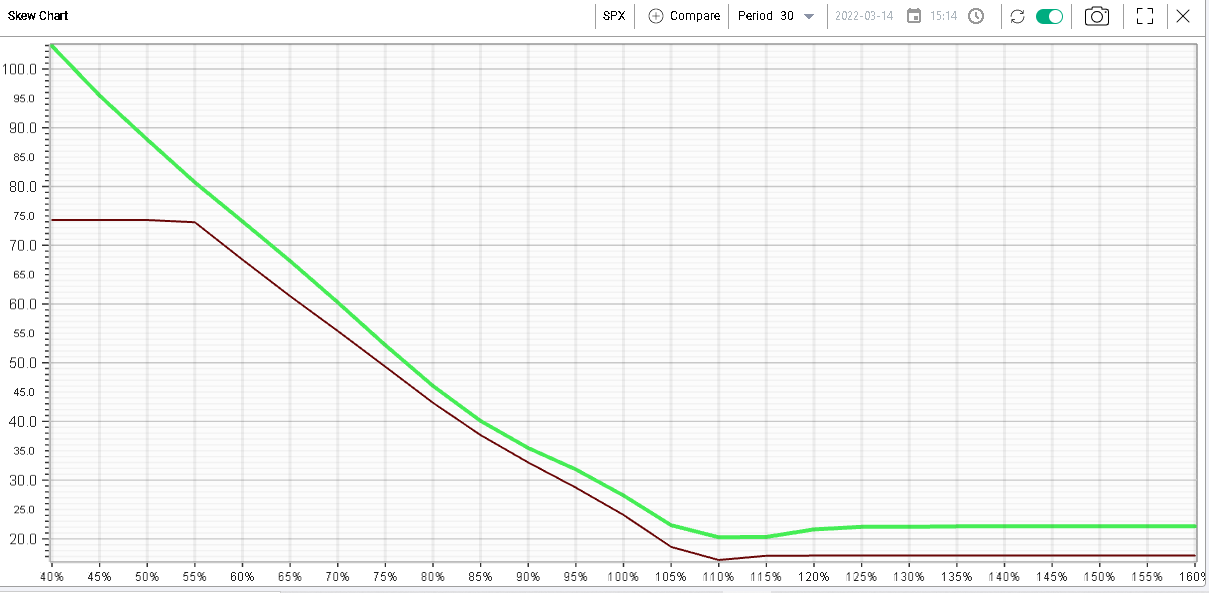
On that last point, looking at the skew chart as of yesterday in green and comparing it with the skew chart at the Feb’22 expiration gives some useful information. |
|
We can see on the above that although all implied volatilities shifted higher, the move was more significant for upside options than downside ones. Does it mean that we can safely conclude that calls were mostly bought by end users? Not at all, this is nothing more than a hypothesis that would require much more testing to be validated. |
Note that with IVOLLIVE, this analysis can be performed on any underlier where you have a position or consider taking one. |
Disclaimer - This information is provided for general information and marketing purposes only. The content of the presentation does not constitute investment advice or a recommendation. IVolatility.com and its partners do not guarantee that this information is error free. The data shown in this presentation are not necessarily real time data. IVolatility.com and its partners will not be liable for any loss or damage, including without limitation, any loss of profit, which may arise directly or indirectly from the use or reliance on the information. When trading, you should consider whether you can afford to take the high risk of losing your money. You should not make decisions that are only based on the information provided in this video. Please be aware that information and research based on historical data or performance do not guarantee future performance or results. Past performance is not necessarily indicative of future results, and any person acting on this information does so entirely at their own risk. |
