We offer multiple professional grade services to help you gain insight on volatility trading. Do not hesitate to try our products FOR FREE by clicking HERE |
The Market Update is a daily newsletter written by the team at iVolatility.com. Leveraging our analytics and data we are able to update you on key developments in the volatility market. To receive the Market Update directly into your inbox, please open a free account or visit our SITE where it is published every day. |
Market Update: 2022-03-09 |
European markets managed to stabilize on Tuesday and have been pushing higher this morning. It seems that markets are becoming more constructive on the possibility of a discussion between Russia and Ukraine which is helping risk assets. |
US markets underperformed again on Tuesday but were down only marginally, all headline indices were less than 1% lower on the day. |
Implied volatilities deflated over the day with 30d IVX for European indices down about 2 points on the day and 30d IVX for US indices about 1 point lower. |
Within the DJIA, single stocks were overall pretty quiet on the day with a few exceptions: |
|
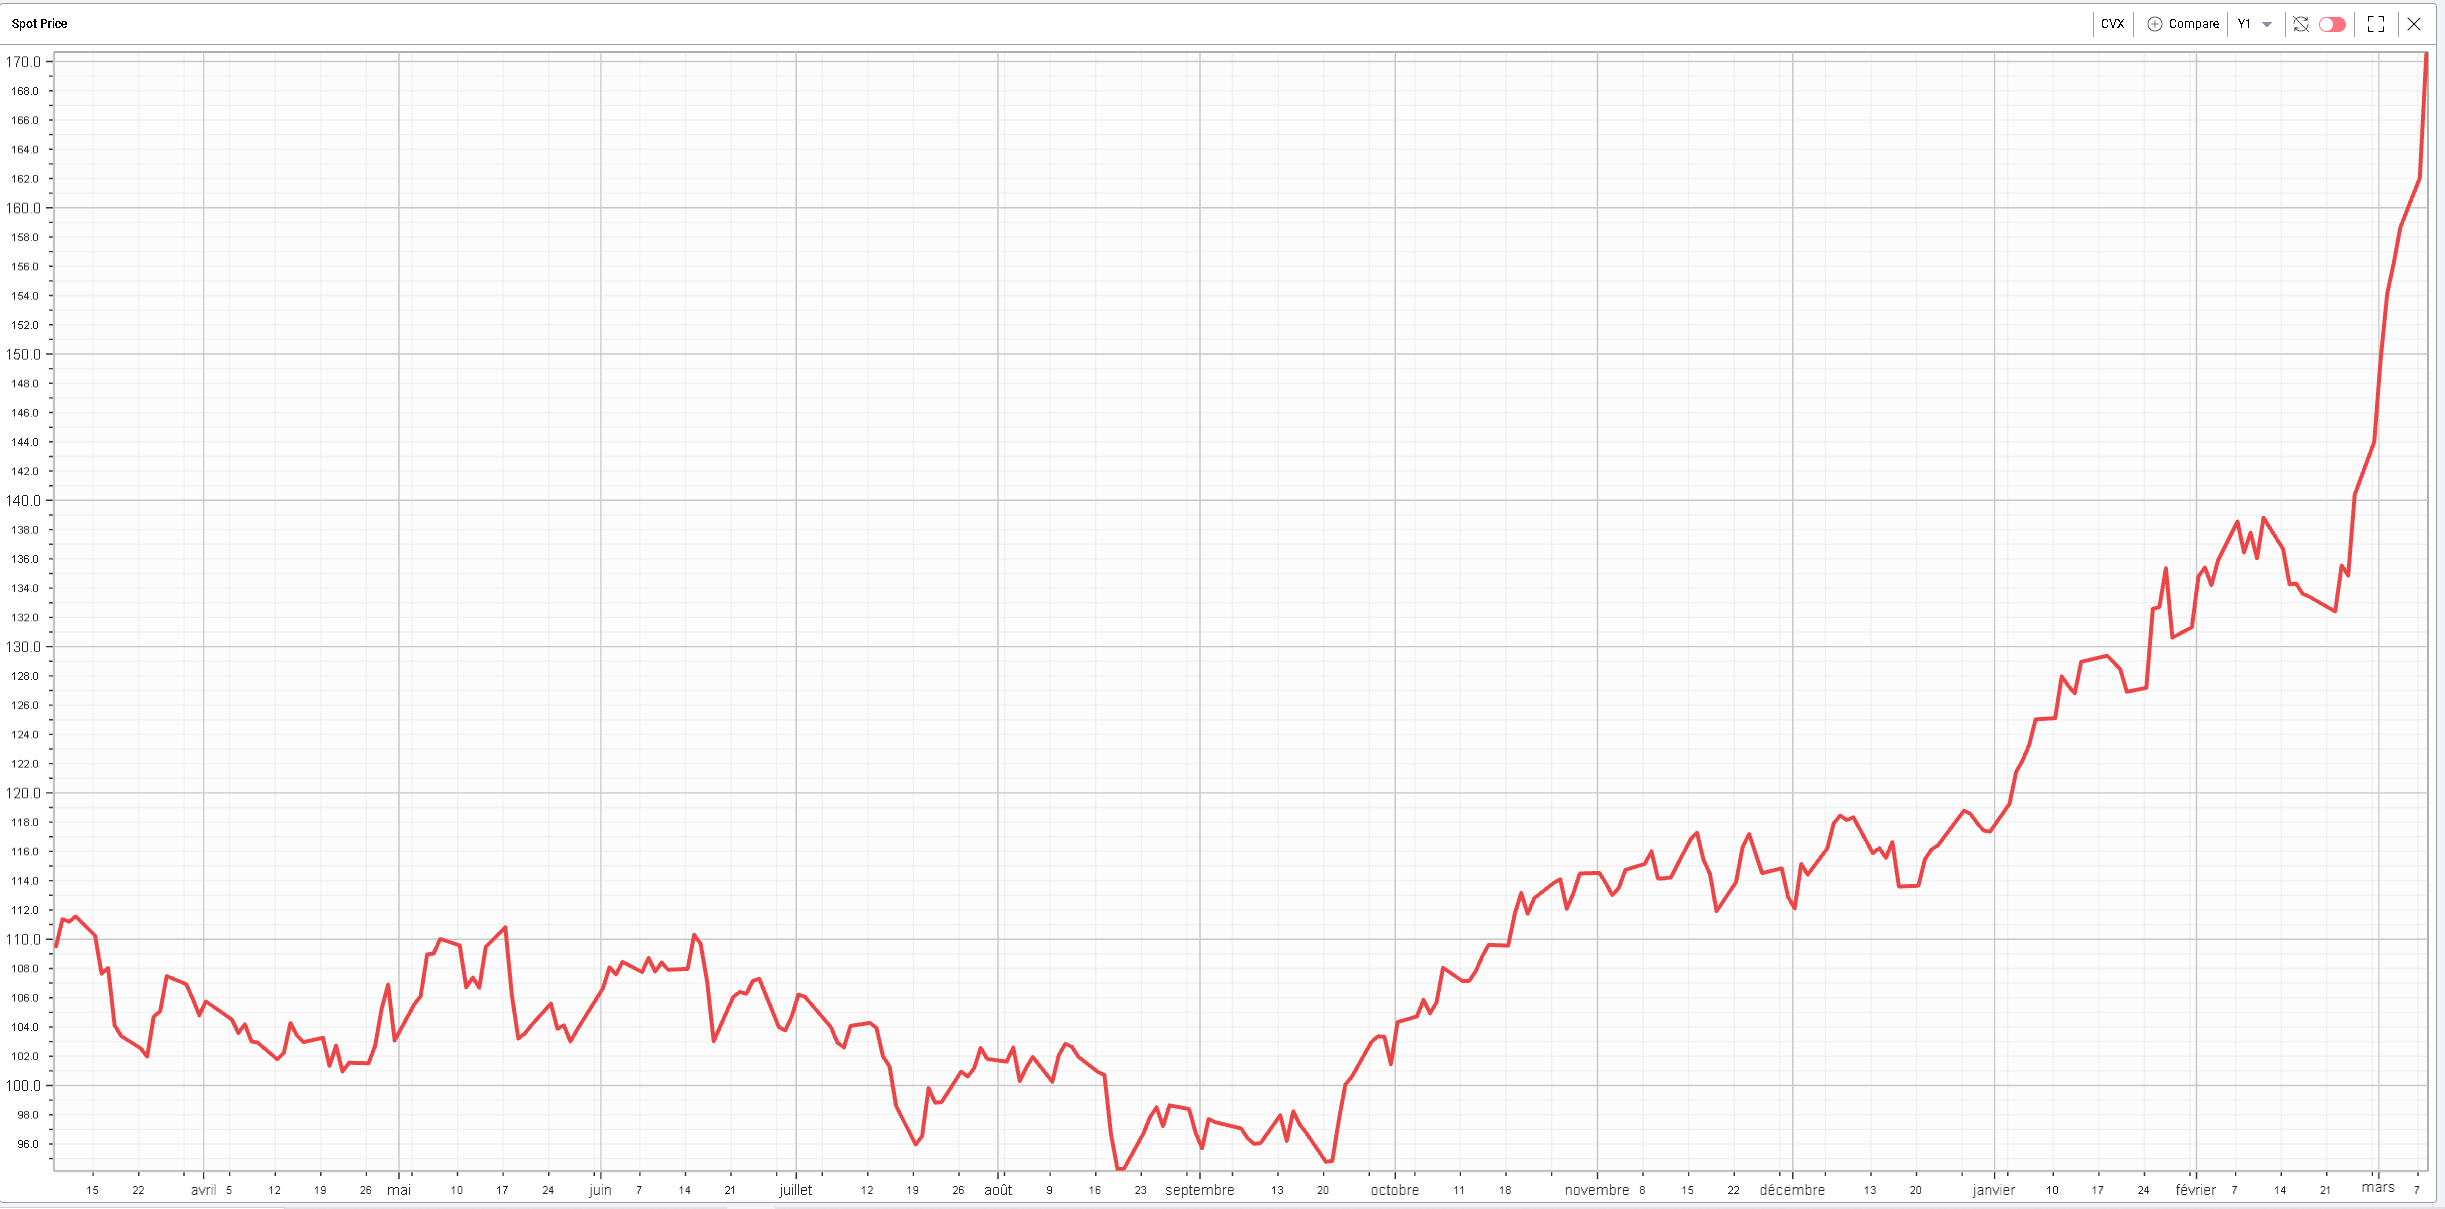
Looking at stocks like CVX, it is obviously difficult to know where this up-move will end. Since the 18th Feb’22, the stock is up about 28% as shown below. |
|
During the same period, the 30d IVX has gone up almost 16 points to 45.5 as shown below. |
|
The four stocks we highlighted in our last market update (AMZN – AAPL – MSFT – TSLA) pressed lower with AAPL outperforming down only 2.6%. Amazon finished the day 5.6% lower, MSFT was 3.8% lower and TSLA closed down 4%. |
Those mega caps carry a lot of weight, not only because they make up a large portion of indices but also because of how much they can impact sentiment both on the upside and the downside. It will remain very important to keep an eye on their price action over the next few days. |
AXP was the worst performing stock (around −8%) of the DJIA as it announced that it would exist Russia and Belarus. BA was down more than 6% on the back of higher oil prices. Multiple global brands also finished the day about 5% lower. Those include: NKE – DIS – MCD and V. |
In contrast to last week when it was still possible to find some differences between implied volatilities relative positions, it seems that yesterday’s move saw a lot of capitulation on the vol front as well. |
|
This creates a situation where traders who are long the stock and unwilling to sell may find it attractive to sell upside calls as a way to exit their positions. For instance, the $175 calls on CVX with expiration 2022-04-14 were priced 5.5 @ 8 at the close yesterday (spot price of $170.53). |
With a mid-price of 6.75, this creates a breakeven point of $181.75 or 6.7% higher than current spot. |
Using the advanced calculator, we find that there is roughly 30% theoretical chance of the stock finishing above that level by the April expiration and about 51% of the stock finishing below $170. |
|
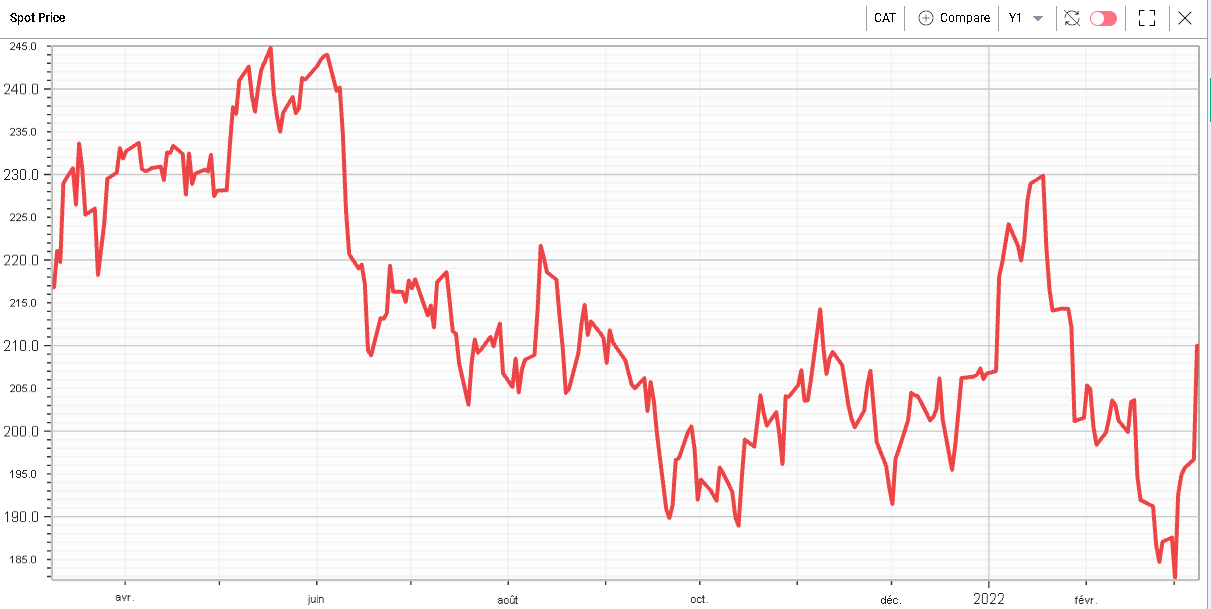
In CAT the price action yesterday was very different from that of the previous few weeks. Is it the beginning of a new trend or simply a bounce within a continuation of the prevailing trend? Only time will tell. |
|
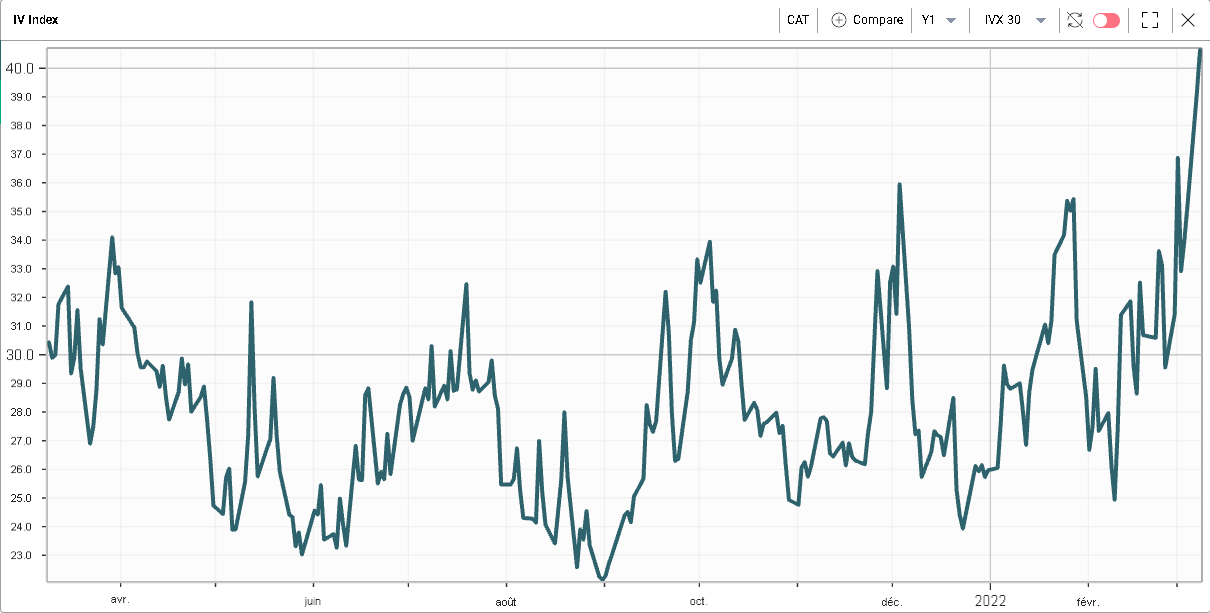
For traders looking to play this stock on the upside, a quick look at its 30d IVX for the past 12 months shows that implied volatility is rather on the high side, pretty much at its highest level for the last year. As a result, structures carrying smaller exposures to volatility such as bull or bear vertical spread would screen better than outright calls or puts. |
|
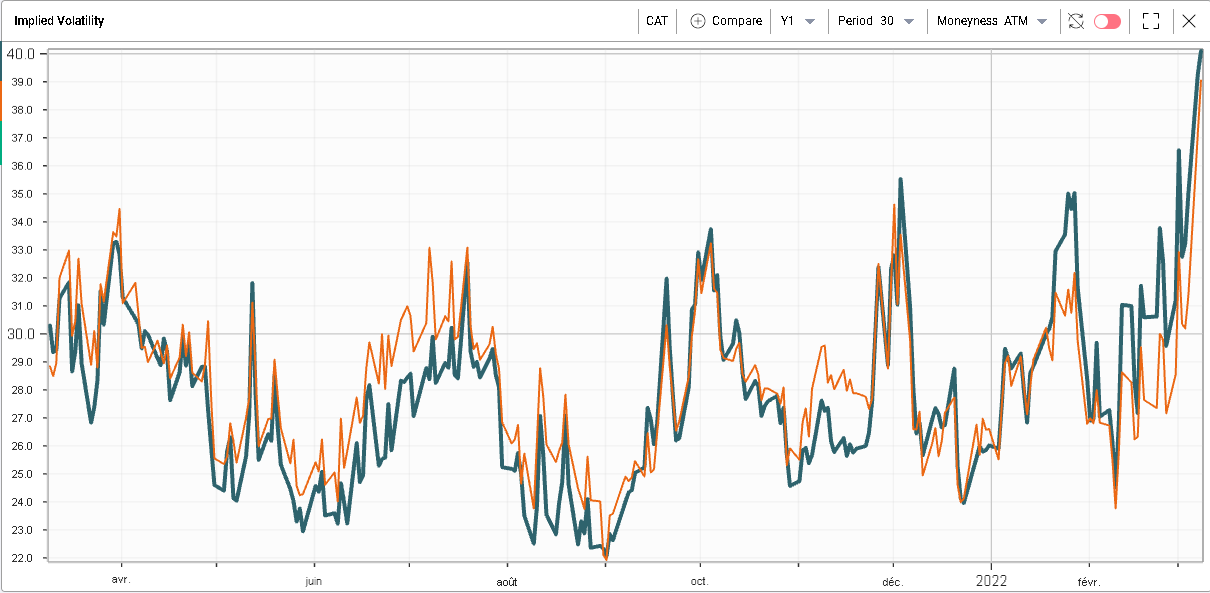
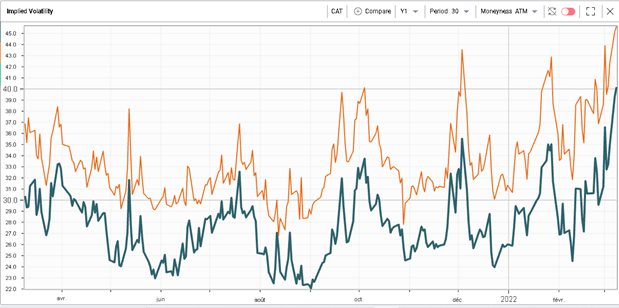
A further check in order to validate that idea could be to look at the historical relationship between for instance the 30d 100% strike volatility and the 30d 110% strike volatility. When doing a bull vertical spread, we will generally be buying a strike close to the money and selling a strike further out. Using 100% and 110% as proxies can be helpful to ensure that we are not buying a volatility that looks too expensive historically relative to the one we are selling. |
In the example below on CAT, we can see that the 100% strike volatility and the 110% strike volatility are both trading in line which is reassuring from the perspective of entering a long bull vertical spread. |
Orange = 30d 110% strike / Blue = 30d 100% strike |
Doing the same analysis on the 90% and 100% strikes with 30d period on CAT gives the following chart: |
Orange = 30d 90% strike / Blue = 30d 100% strike |
In this case again we can see that the implied volatility of the 90% strike and the 100% strike are both moving together which is reassuring here again for traders looking to enter long bear vertical spreads. |
Disclaimer - This information is provided for general information and marketing purposes only. The content of the presentation does not constitute investment advice or a recommendation. IVolatility.com and its partners do not guarantee that this information is error free. The data shown in this presentation are not necessarily real time data. IVolatility.com and its partners will not be liable for any loss or damage, including without limitation, any loss of profit, which may arise directly or indirectly from the use or reliance on the information. When trading, you should consider whether you can afford to take the high risk of losing your money. You should not make decisions that are only based on the information provided in this video. Please be aware that information and research based on historical data or performance do not guarantee future performance or results. Past performance is not necessarily indicative of future results, and any person acting on this information does so entirely at their own risk. |
