Market Update: 2022-02-10 |
Implied volatilities continued to deflate yesterday almost in a parallel fashion. Below the term structure change of the SPX shows 30d IV down almost 1.5 points, 60d IV down 1.25points and 1 year IV down 0.5 points. |
|
In the NDX, we witnessed an even more aggressive reaction with 30d IV down 1.75 points and 1 year IV down almost 0.75 points. |
|
Over in Europe, major indices played catch up and IV deflated aggressively as well. Most notable was the change in IV in the 30 days bucket for the SX7E (Eurozone banks index) which was down 1.75 points on the back of easing stress on peripheral spreads. |
The DOW underperformance in spot was interesting with the index up a mere 1%. Implied volatilities were offered but sellers were more hesitant compared to other headline indices. Front-end vols are down around 1 point while longer dated are down around 0.5 point. |
Amongst the components of the DOW, DIS was the outlier being the only name where implied volatilities were paid. This was particularly true in the front-end of the curve as the stock was up more than 3% going into earnings. First look this morning points to a strong open up 7% after what is being described as a strong beat across the street. |
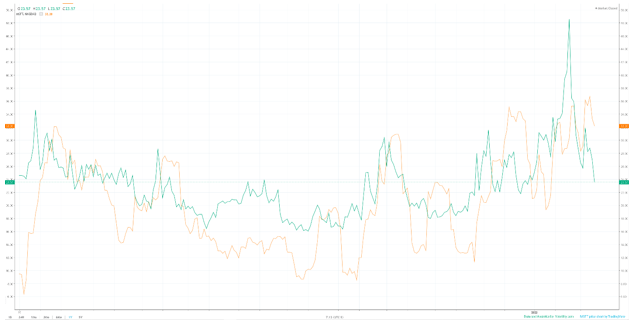
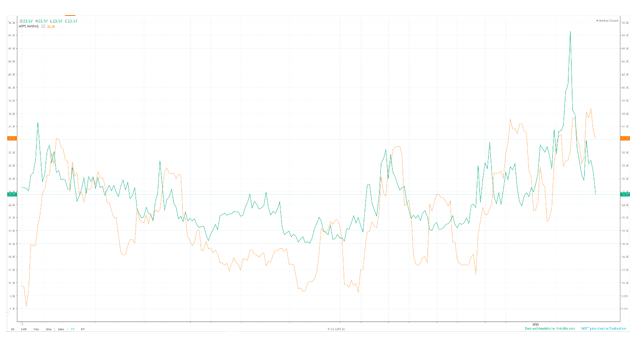
MSFT was the worst performing implied volatility of the DOW. The stock was up 2% and 30d IV dropped more than 3 points, 60d was down around 2.3 points and 1 year was down 1 point. Interestingly, 30d IV is trading at its largest discount for the last 12 months relative to its 10d realized volatility as seen in the chart below. |
|
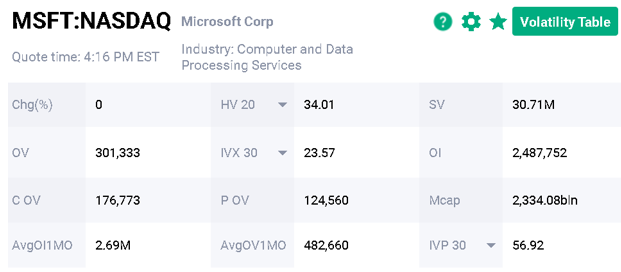
All this is happening on limited volumes in options with around 300k contracts trading. Note that implied are still trading around their 57th percentile over the last 12 months. |
|
Finally, PTON remains very much in focus with the stock up more than 60% from its recent lows, implied volatilities continue to drop despite realized volatilities remaining elevated. The below chart show in green the 30d IV in PTON compared with the 20d HV in orange. 30 days IV managed to settle back below 100, a first since the middle of January. |
|
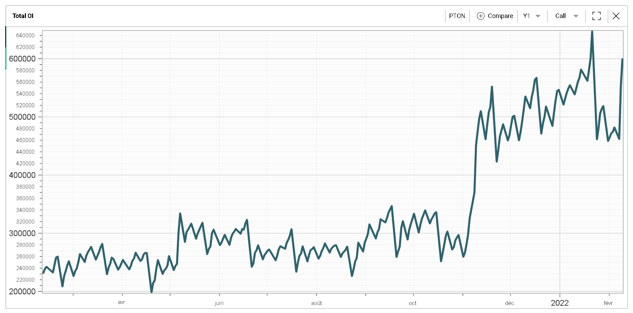
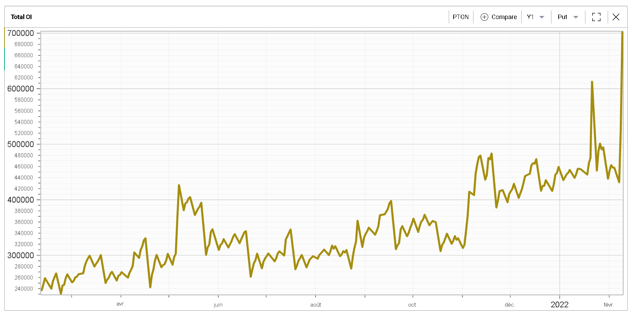
There has been some heavy activity in the name, both in the form of puts and calls trading. We can notice on the charts below the significant increase in open interest since the end of 2021 with a renewed interest over the last few days. |
|
|
For more information and to start you free trial, please visit: |


