Last Week’s Highlights at IVolLive:
- Register HERE for our next live webinar on Tuesday, October 24th where we will cover Harness the Stock Monitor to Run and Create Custom Scans to Create a List of Actionable Trades.
- Get a free IVolLive Trial HERE.
Treasury Bonds: Guillotine or Opportunity?
October 20, 2023
Boring old Treasury Bonds look... interesting:
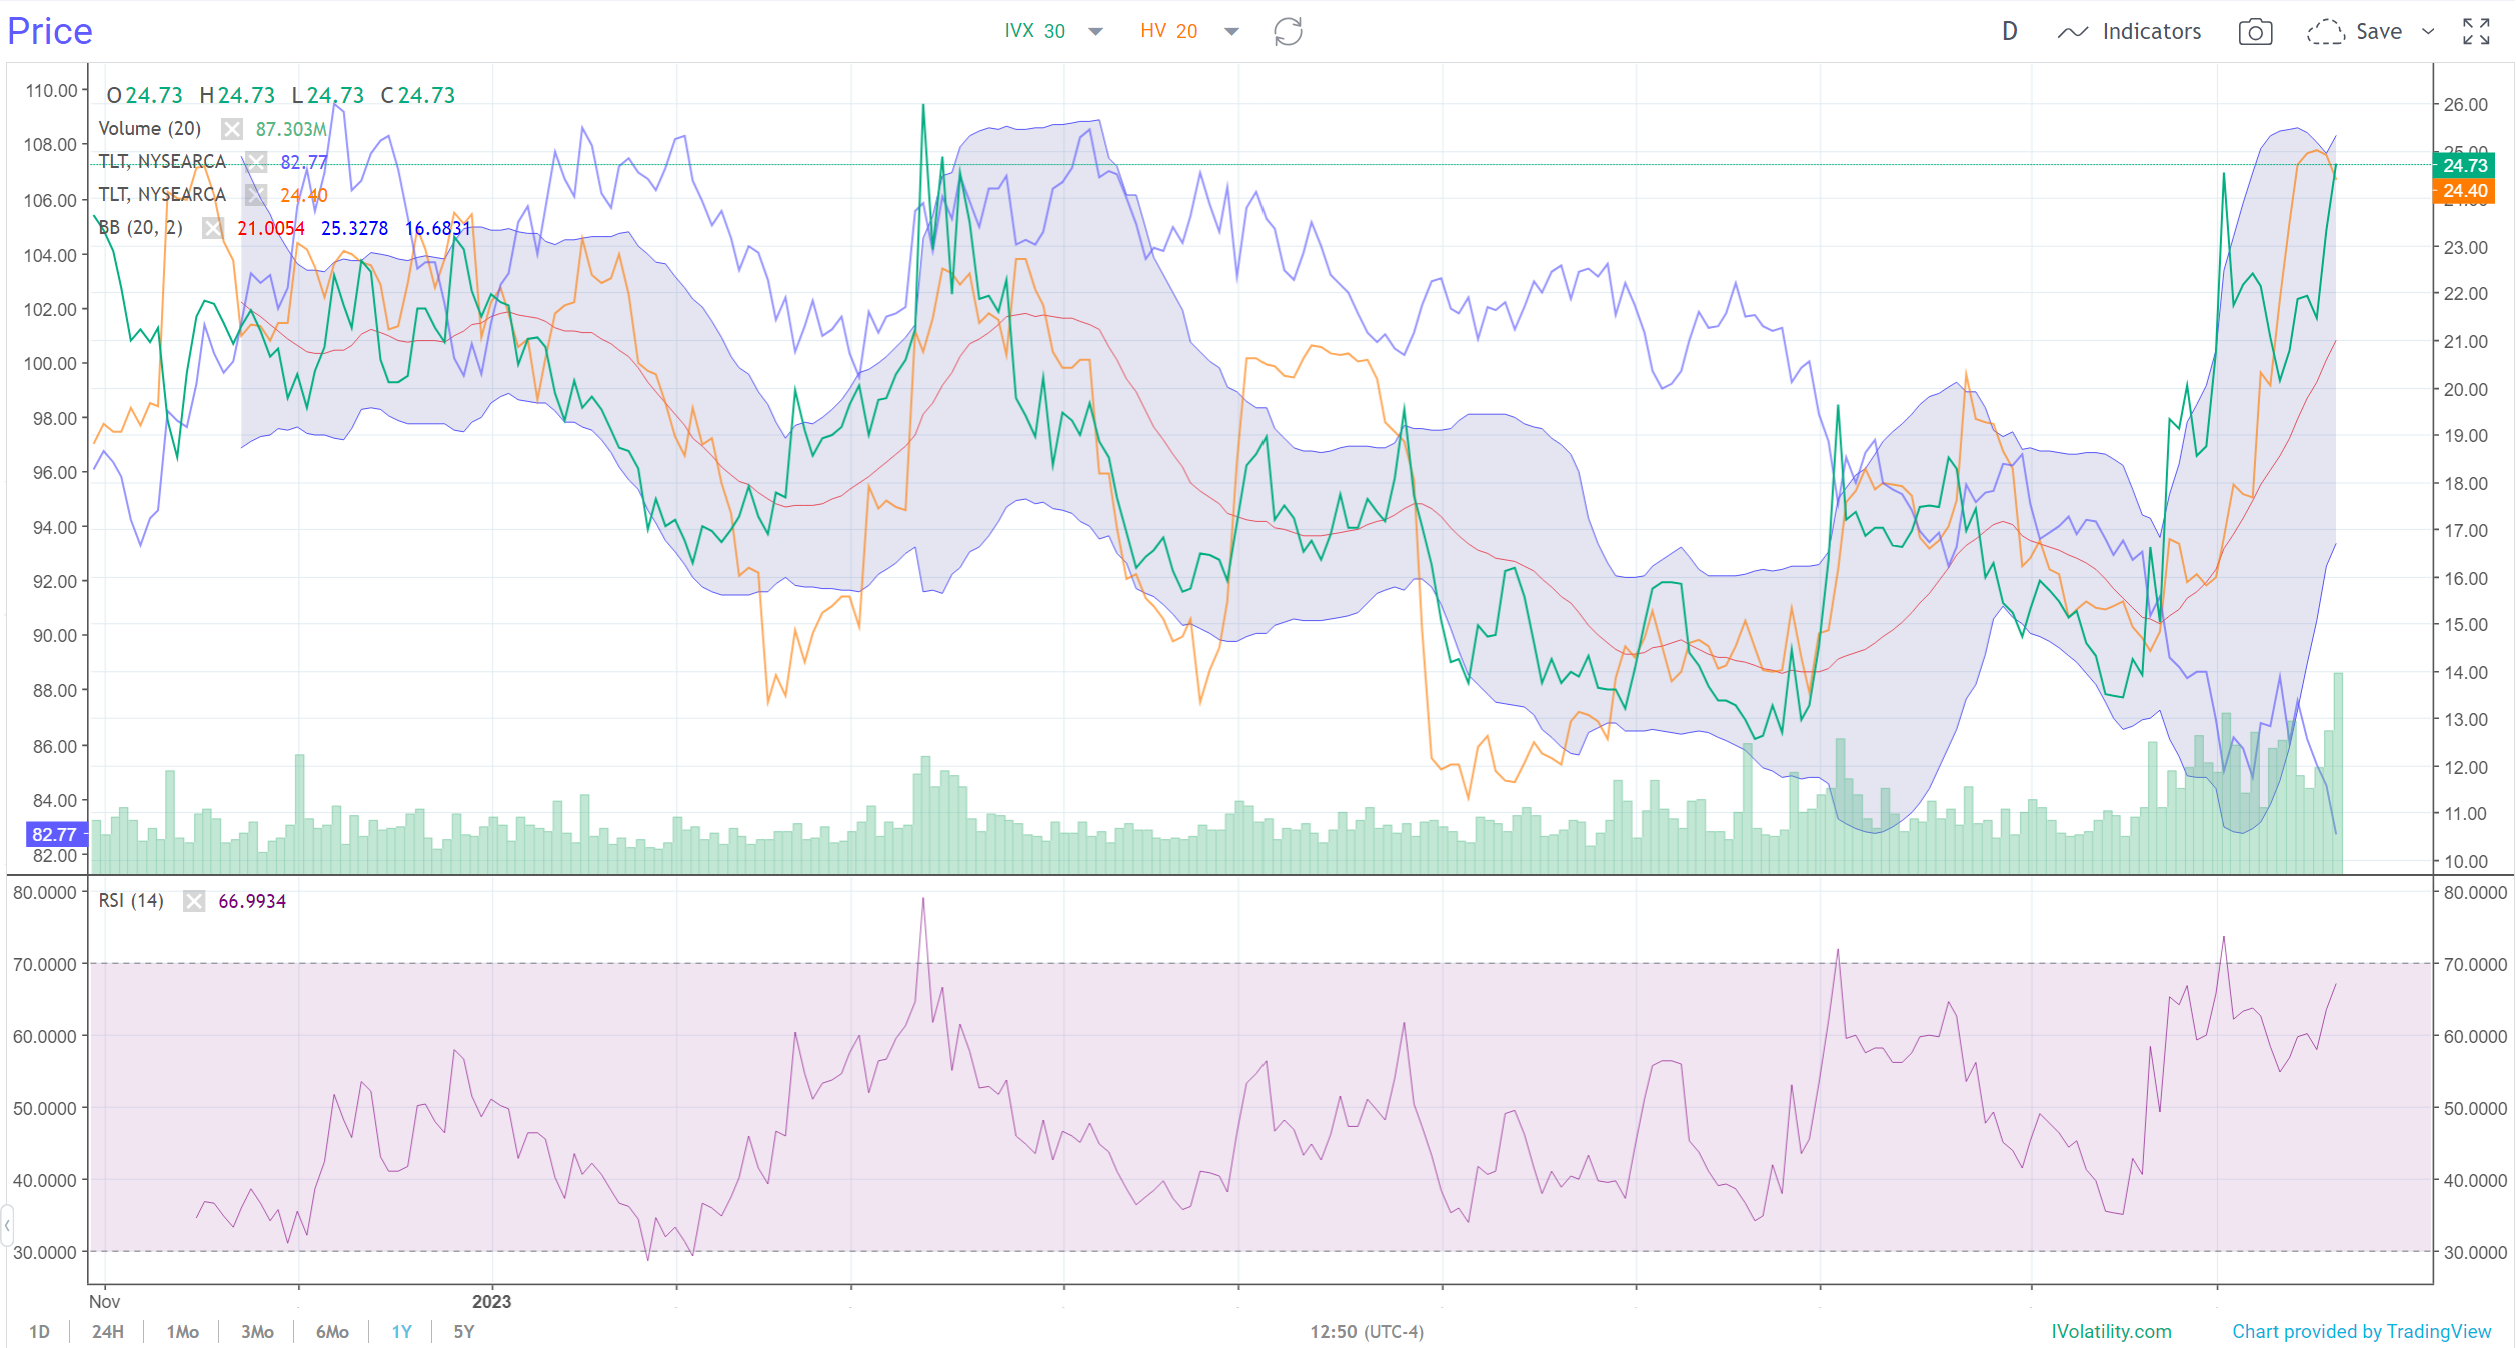
This one-year chart of TLT from IVolLive tells us a lot...
First, we can see that TLT's spot price (the blue line) has been absolutely crushed - crashing to one-year lows around $82 per share.
The decline in share price does make sense. After all, we are in a rising interest rate environment. And when rates are rising, 20-year Treasuries (what TLT holds) are likely to head lower - this is the inverse relationship between price and bond yields.
The thing is... this sell-off could be overdone...
You see, nothing heads in a straight line indefinitely - either up or down. TLT, considered a "safe haven asset", has fallen around 20% since this summer. That's a monster move for an ordinarily sleepy asset like TLT.
Not only that, but as we look at the technicals, we can see that Implied Volatility (the green line on the chart) is severely stretched to the upside - it's trading near the upper Bollinger Band and close to 70 on the RSI. In other words, the sell-off (and corresponding rise in volatility) could be headed for a pause.
How to Play It
This setup in TLT is similar to around this time last year. Following these conditions, TLT went on to surge close to 20% in a month-and-a-half.
Of course, past performance is not a guarantee of future results. But savvy traders could mark TLT here, and analyze ideal entry points for a short term spread, call option, or selling a put option on TLT.
Previous issues are located under the News tab on our website.