Last Week’s Highlights at IVolLive:
- Don't forget to register for our next live webinar on Tuesday, August 15th 2023 Webinar Topic: Charts Part III: How to Add, View, and Use Price, Volatility, and Implied Volatility Charts to Create Options Trades HERE
- Get a free IVolLive Trial HERE.
Inflation Goes Down: Jerome Powell Still Isn't Happy
August 10, 2023
What's Happening Now in the Markets
What will it take to make Jerome Powell happy? 2%.
That's the stated "comfort level" inflation rate. And unless you have been living under a rock for the past 12-24 months, you're aware inflation has been anything but 2%.
Energy... food... labor... you name it, it's been moving up and to the right. This squeezes consumers and leads to the Fed raising interest rates. The combined effect of this is what makes the markets jittery.
That's why we were watching the recent release of the Consumer Price Index (CPIs) so close. The actual year-over-year print for July came in a bit lower than Wall Streets "expert" consensus of 3.3%. While this synched with expectations, it's still well above the Fed's stated 2% target inflation rate.
So... what to make of it?
Our take is that while the Fed may pause in its interest rate hike cycle, don't expect it to reverse course and lower rates, either. We expect a "wait and see" approach. If the CPI continues to drift lower, the Fed will continue to do nothing, or at most, minimal hikes.
However, if the CPI starts rocketing higher, we would anticipate more hikes.
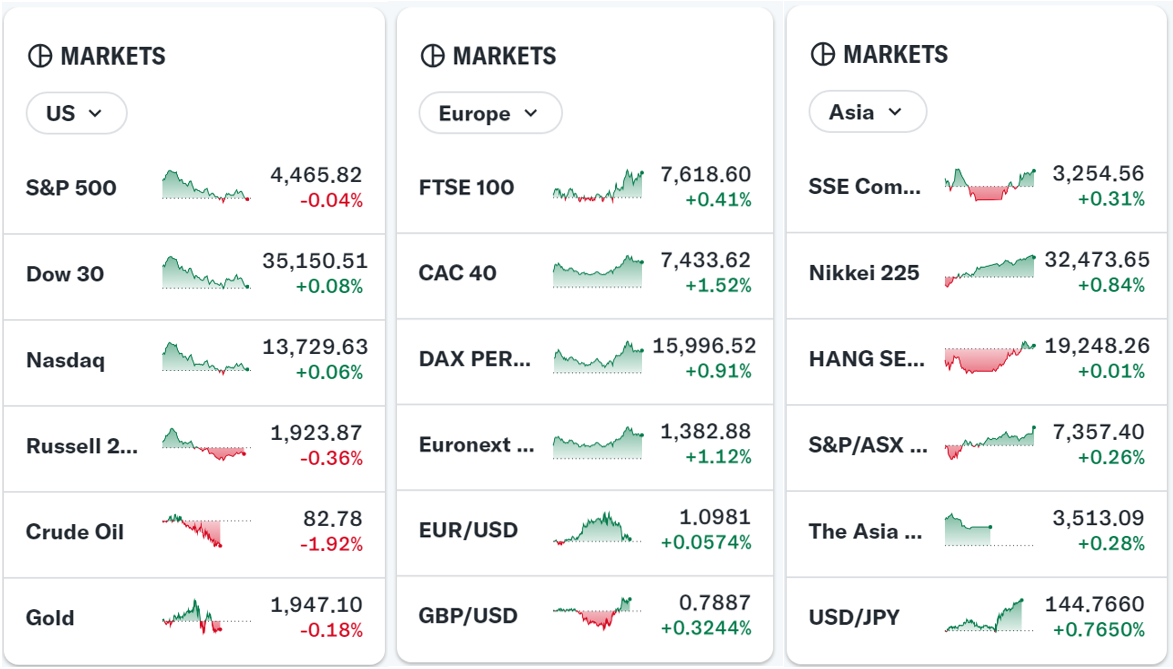
As we zoom in on the markets' reaction to the above, we notice an interesting trend: tech (which we've covered extensively in these pages over the past few weeks) is declining while energy is resurgent.
Indeed, West Texas Intermediate Cride (WTI) is at its highest level since November - diesel is at its highest since January.
In terms of price action and volatility movements, since we've also been talking charts the past few sessions, let's look at energy giant Exon (XOM) vs. tech titan Apple (AAPL):
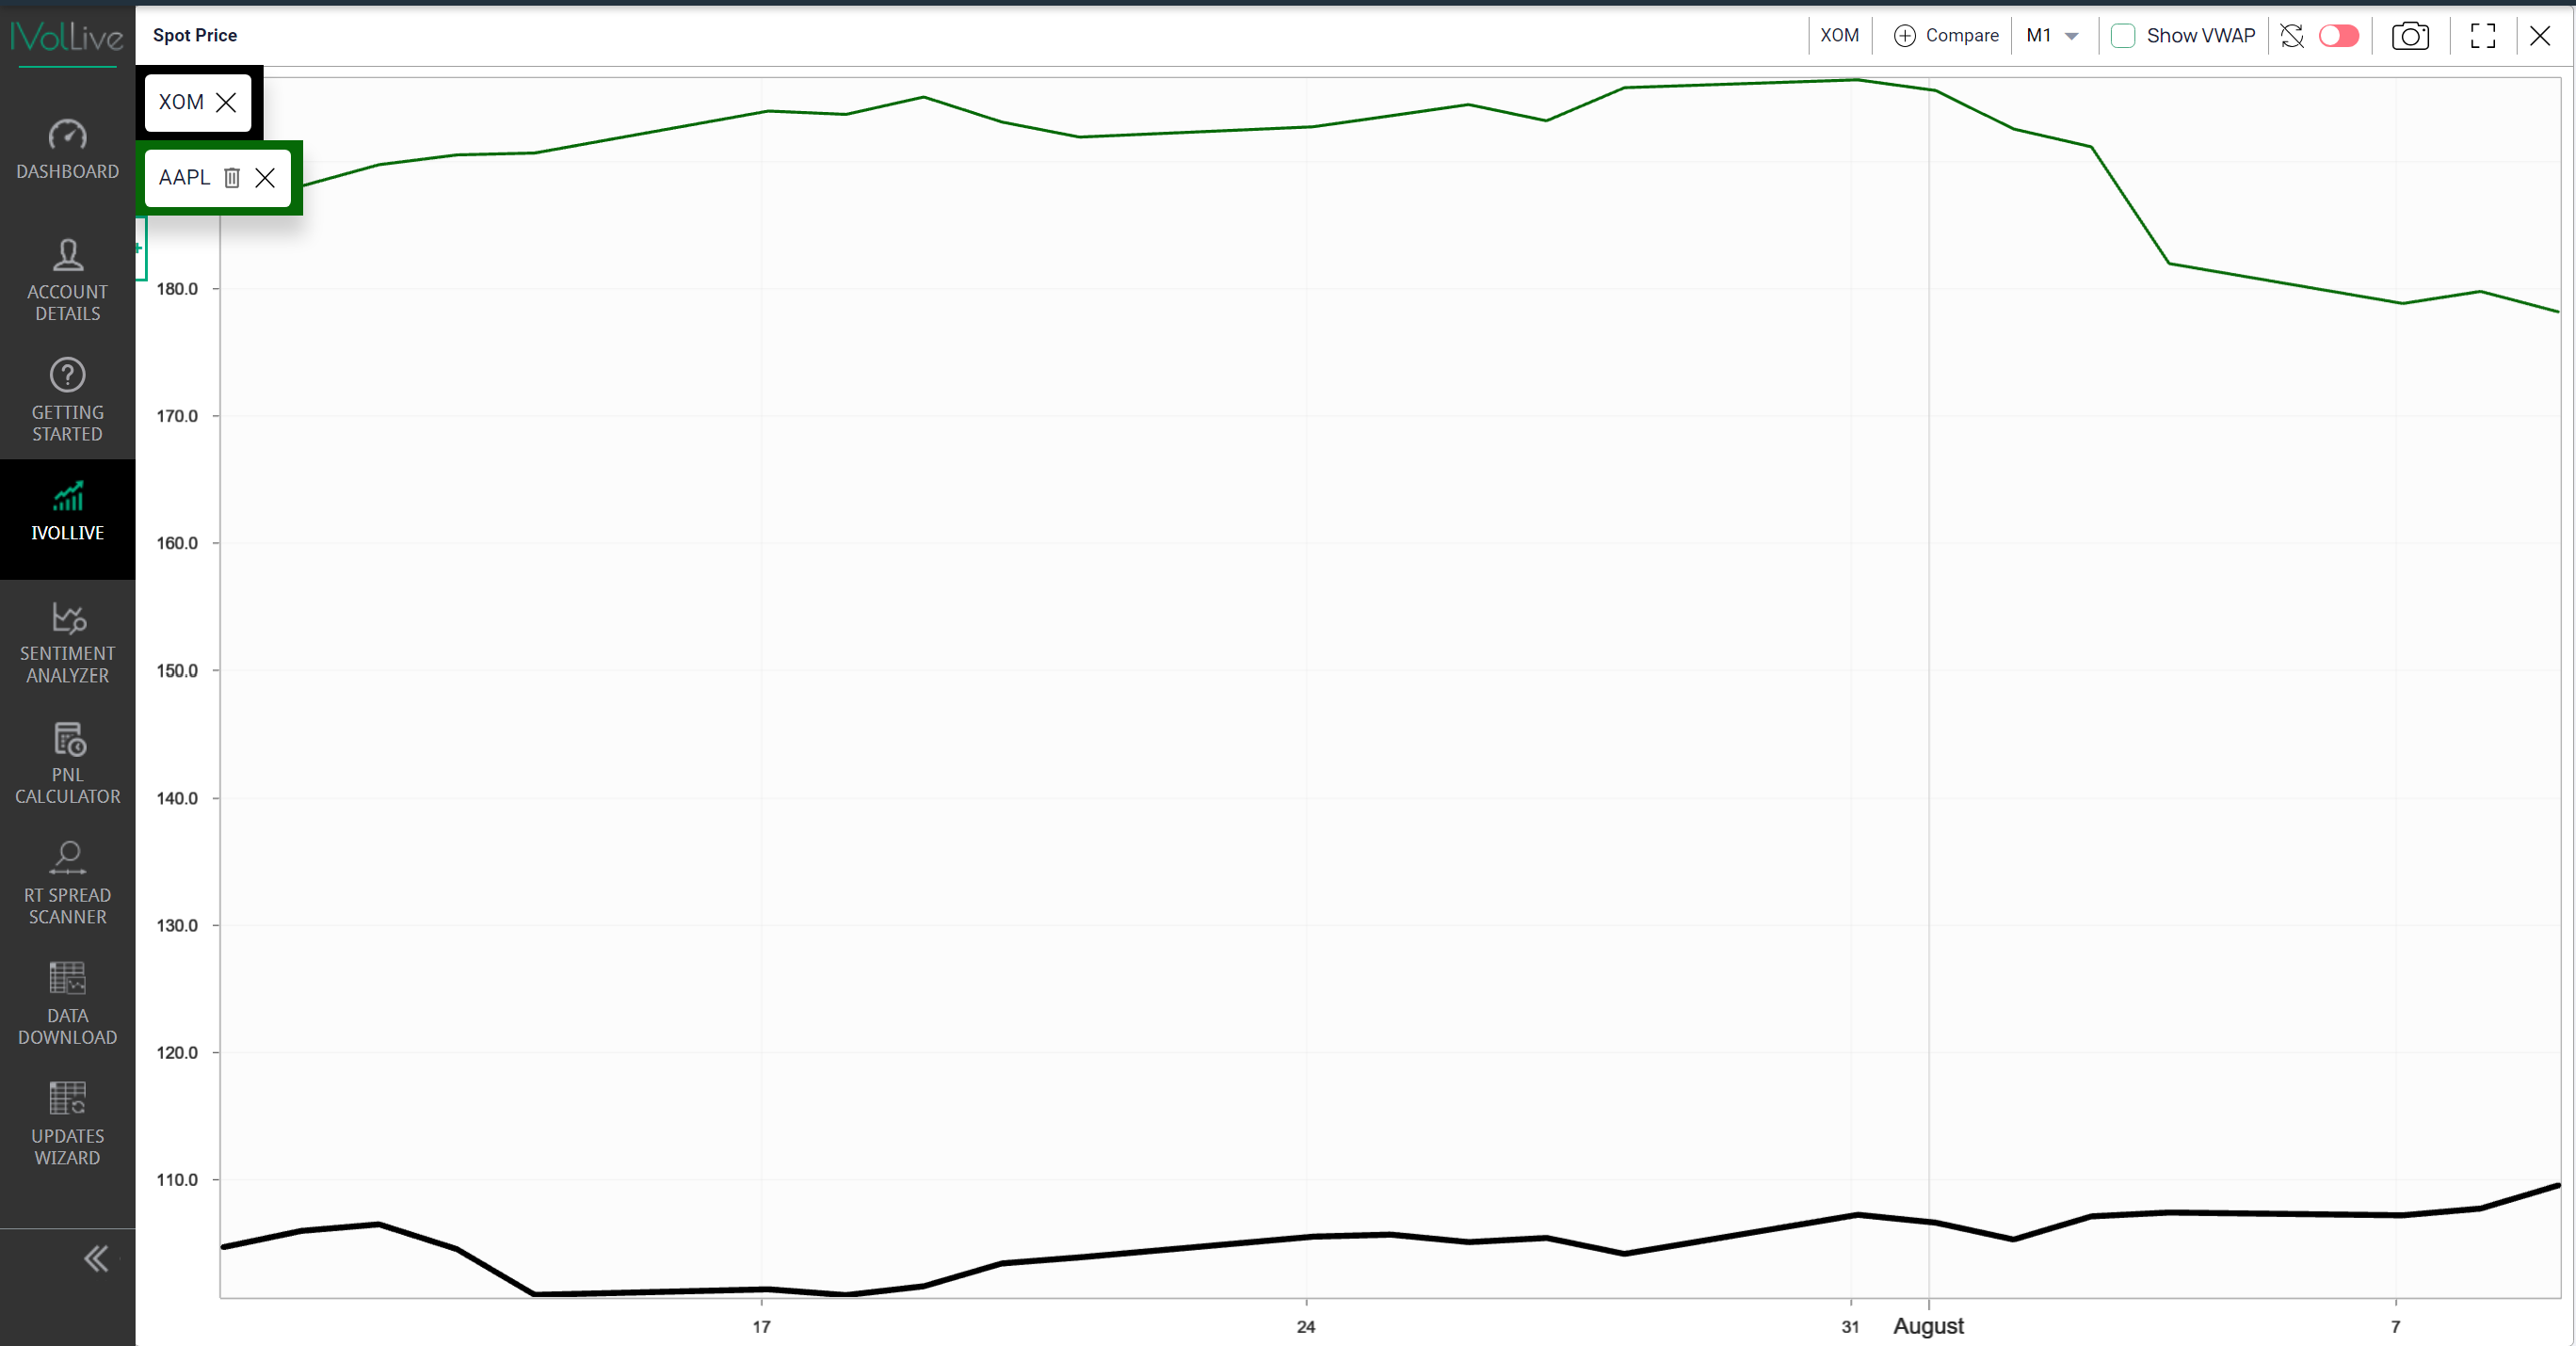
In this one-month chart, we can see Exxon's price (in black) is rising while Apple's is falling.
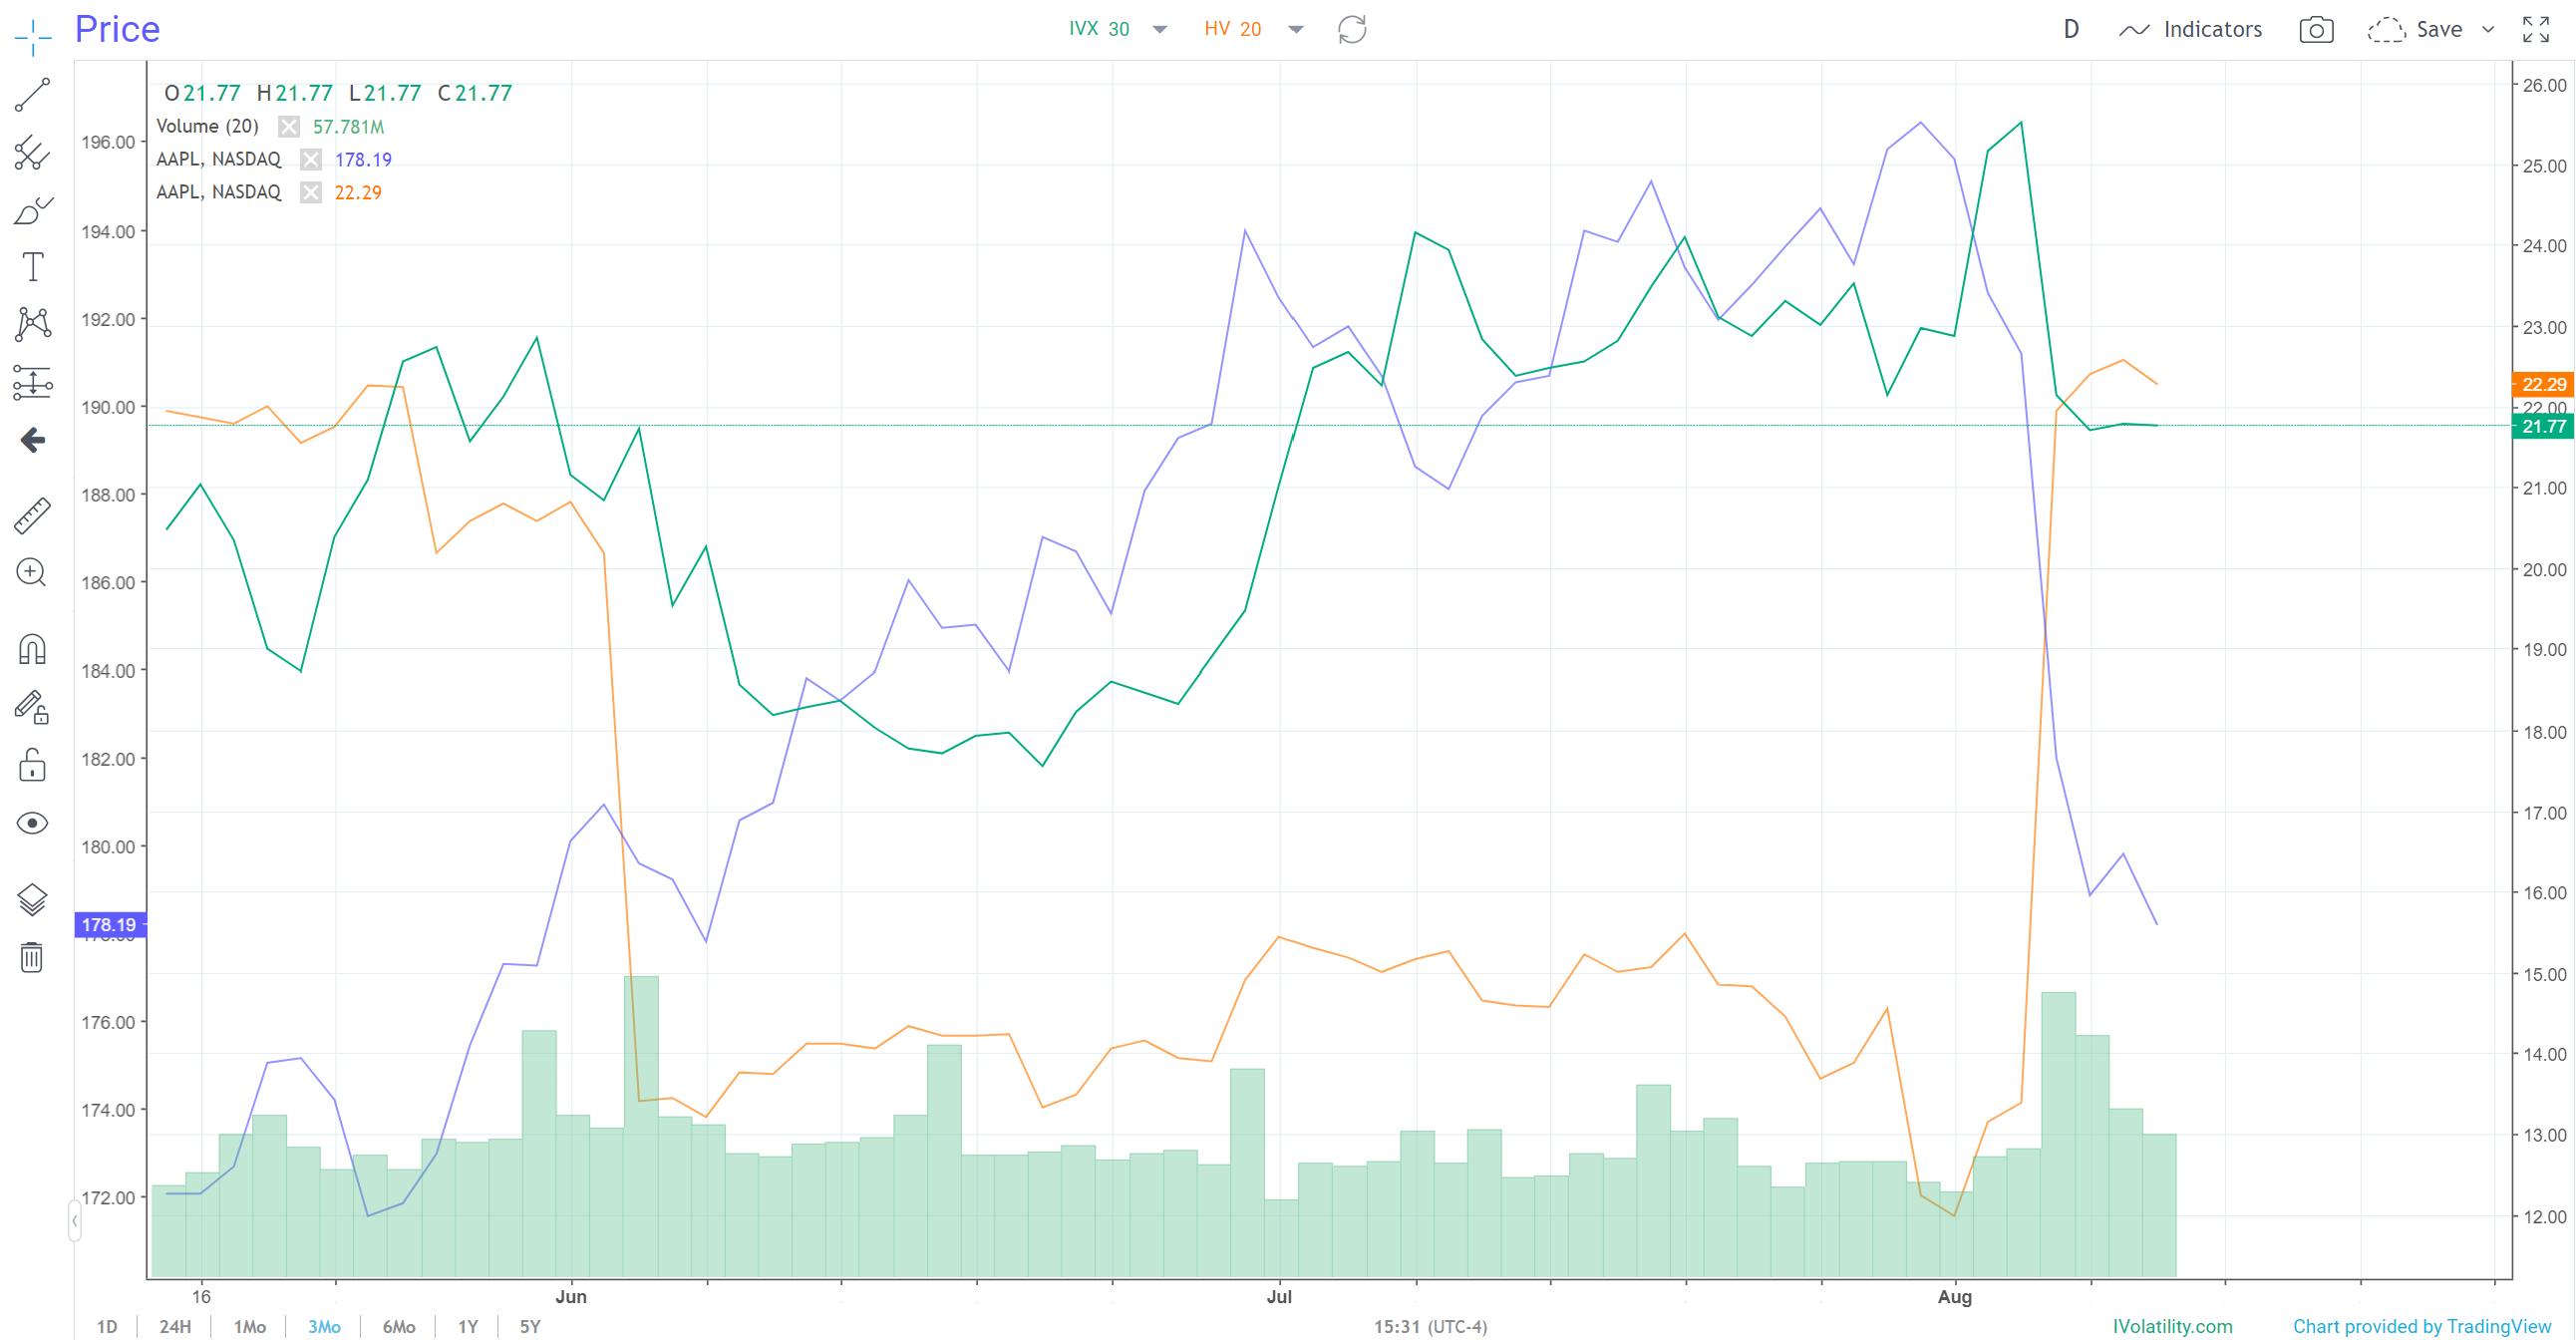
Zooming in on another chart type, here's Apple's falling spot price (blue line) plotted against its rising implied volatility (green line) and rising historical volatility (orange line):
Meanwhile, here's the same parameters for Exxon:
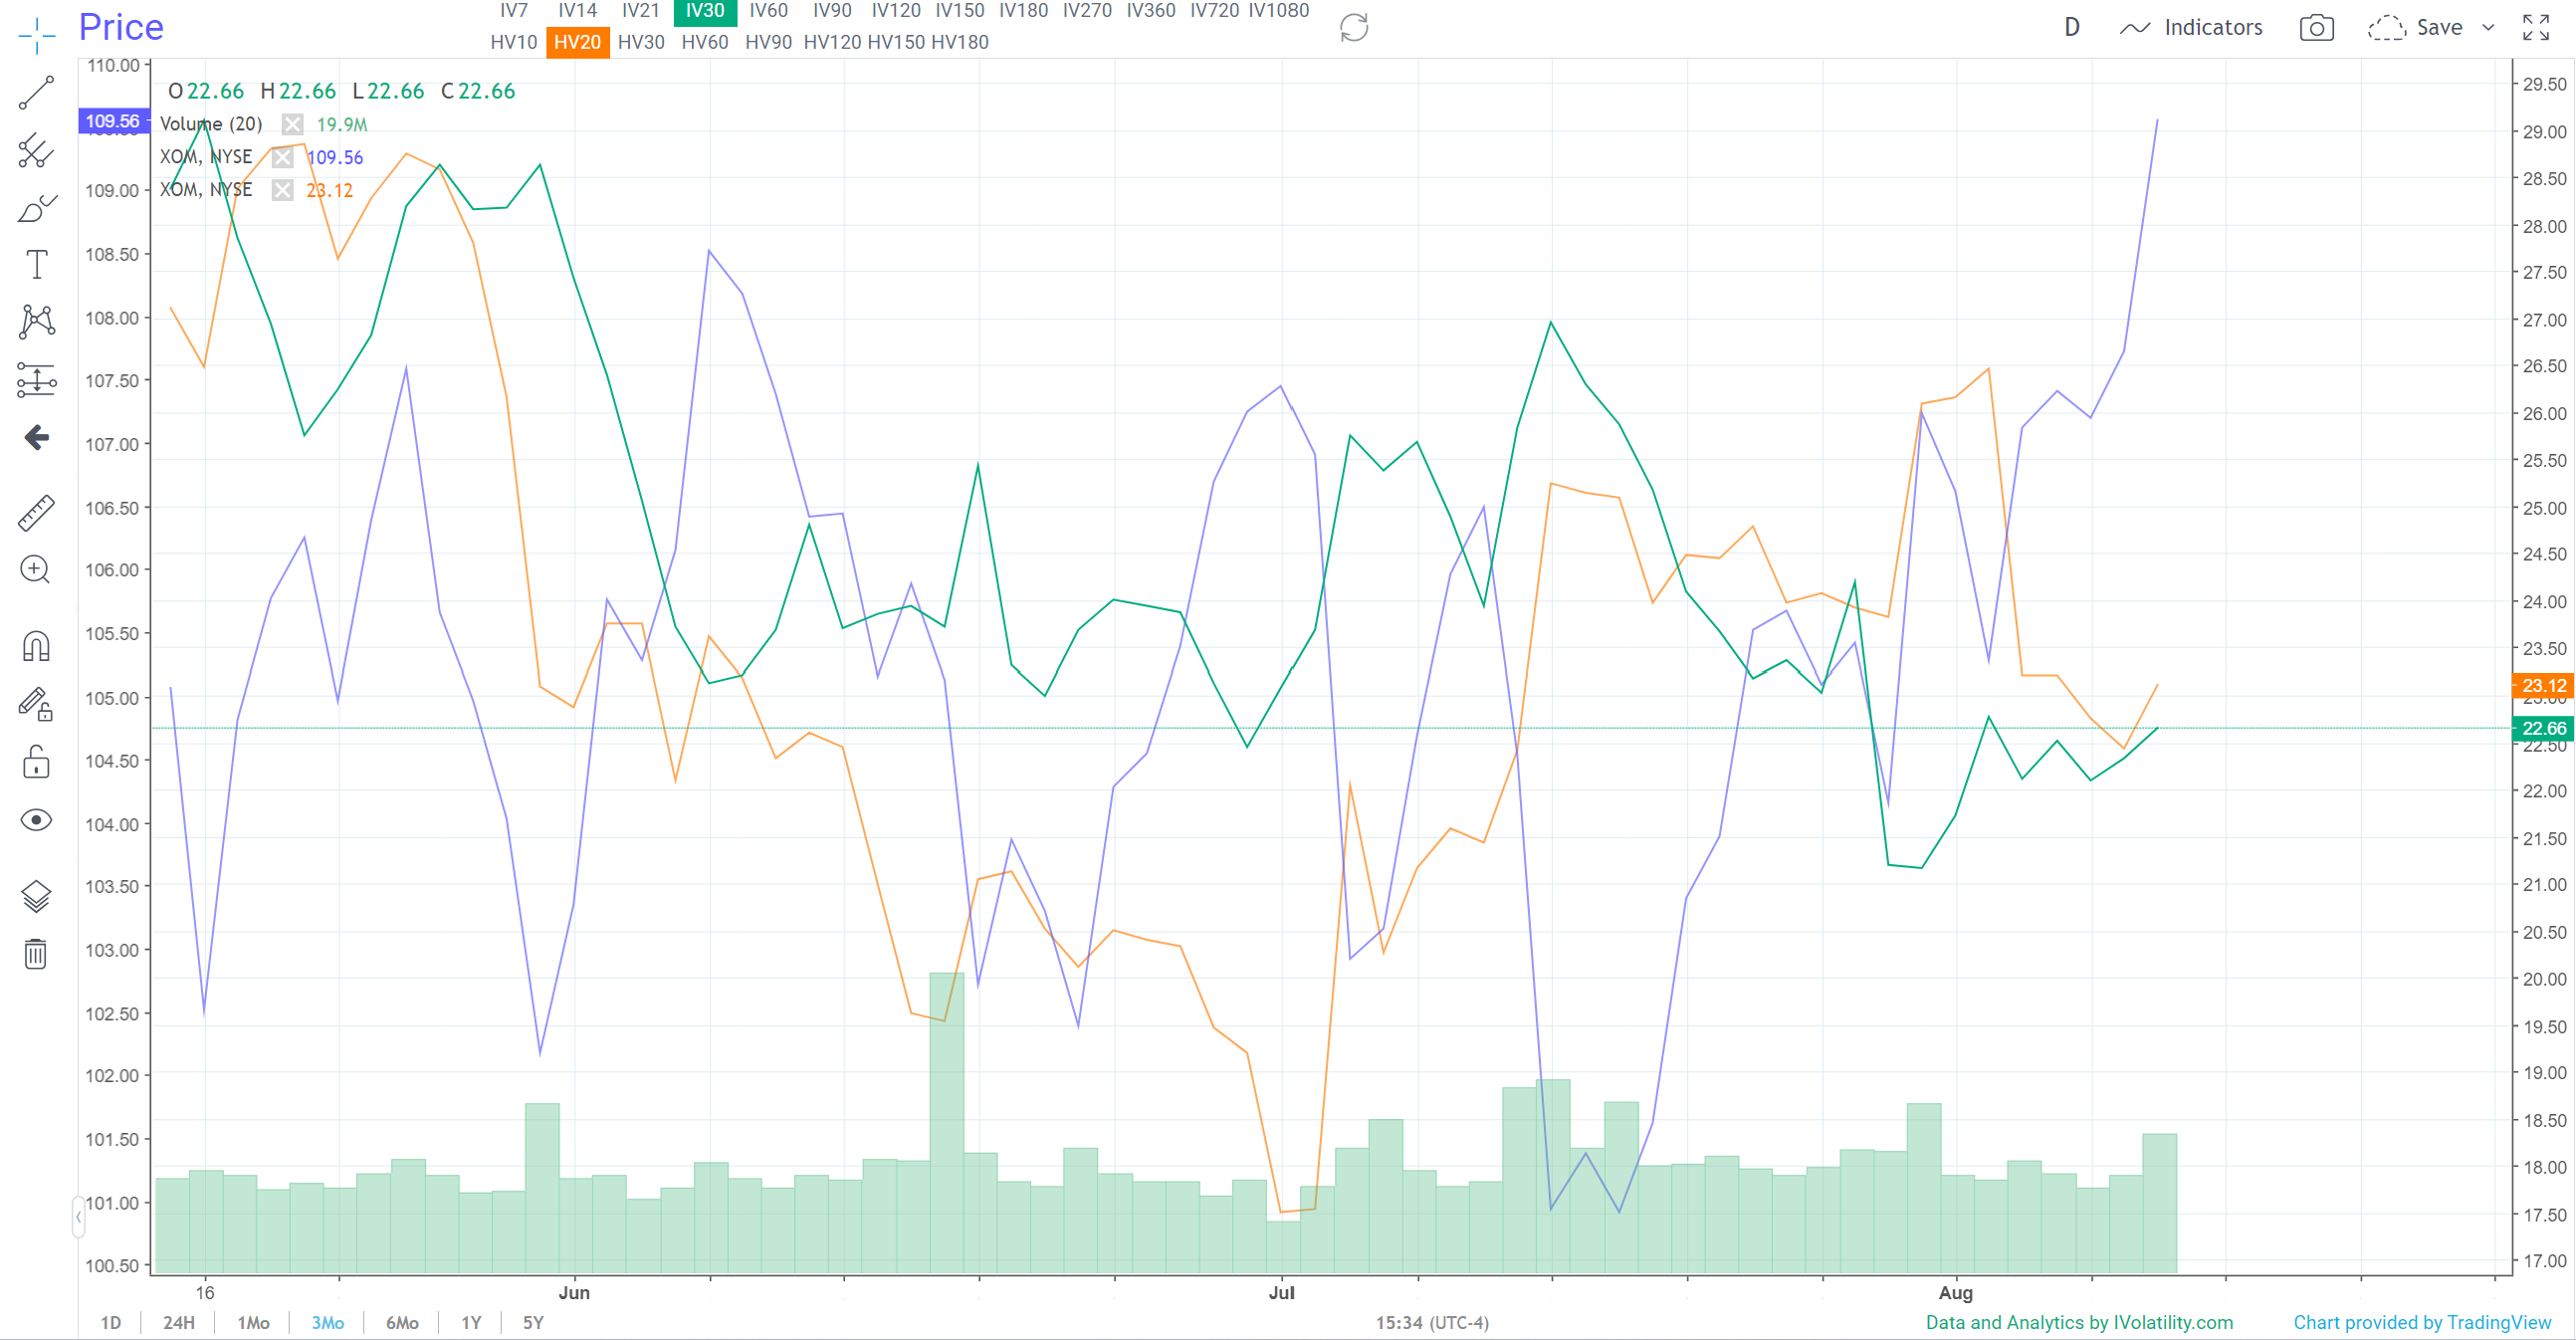
Here, we see the opposite. Price is rising while implied volatility and historical volatility are dropping.
These two charts perfectly demonstrate the inverse relationship we mention often: all else equal, when prices rise, volatility declines, and vice versa.
And tech and energy have been moving opposite one another throughout the year. Tech had a strong first half, look for energy to have a strong finish.
How to Play It
Energy stands to thrive with the dual headwinds of intense consumer and business demand combined with a supply that declines by its very nature. At these levels, we like the idea of going long on well capitalized names that are showing signs of strength like Exxon and Chevron.
Previous issues are located under the News tab on our website.