Last Week’s Highlights at IVolLive:
- Don't forget to register for our next live webinar on Tuesday, July 25th 2023 Webinar Topic: Harness the Stock Monitor to Run and Create Custom Scans to Create a List of Actionable Trades HERE
- Get a free IVolLive Trial HERE.
Another Week, Another All Time Tech High
July 20, 2023


What's Happening Now in the Markets
Another week, another tech giant marching along at all-time highs:
Microsoft announced its much-anticipated AI add-on to its dominant Office365 suite of products (Word, Excel, PowerPoint, and Outlook).
The tech giant named the AI tool "Copilot" and it used ChatGPT to answer emails, summarize meetings, and create things like PowerPoint presentations for an additional $30 per month, per user.
With its sticky customer base of millions of users, Microsoft has a unique way to integrate - and monetize - AI into its existing product line.
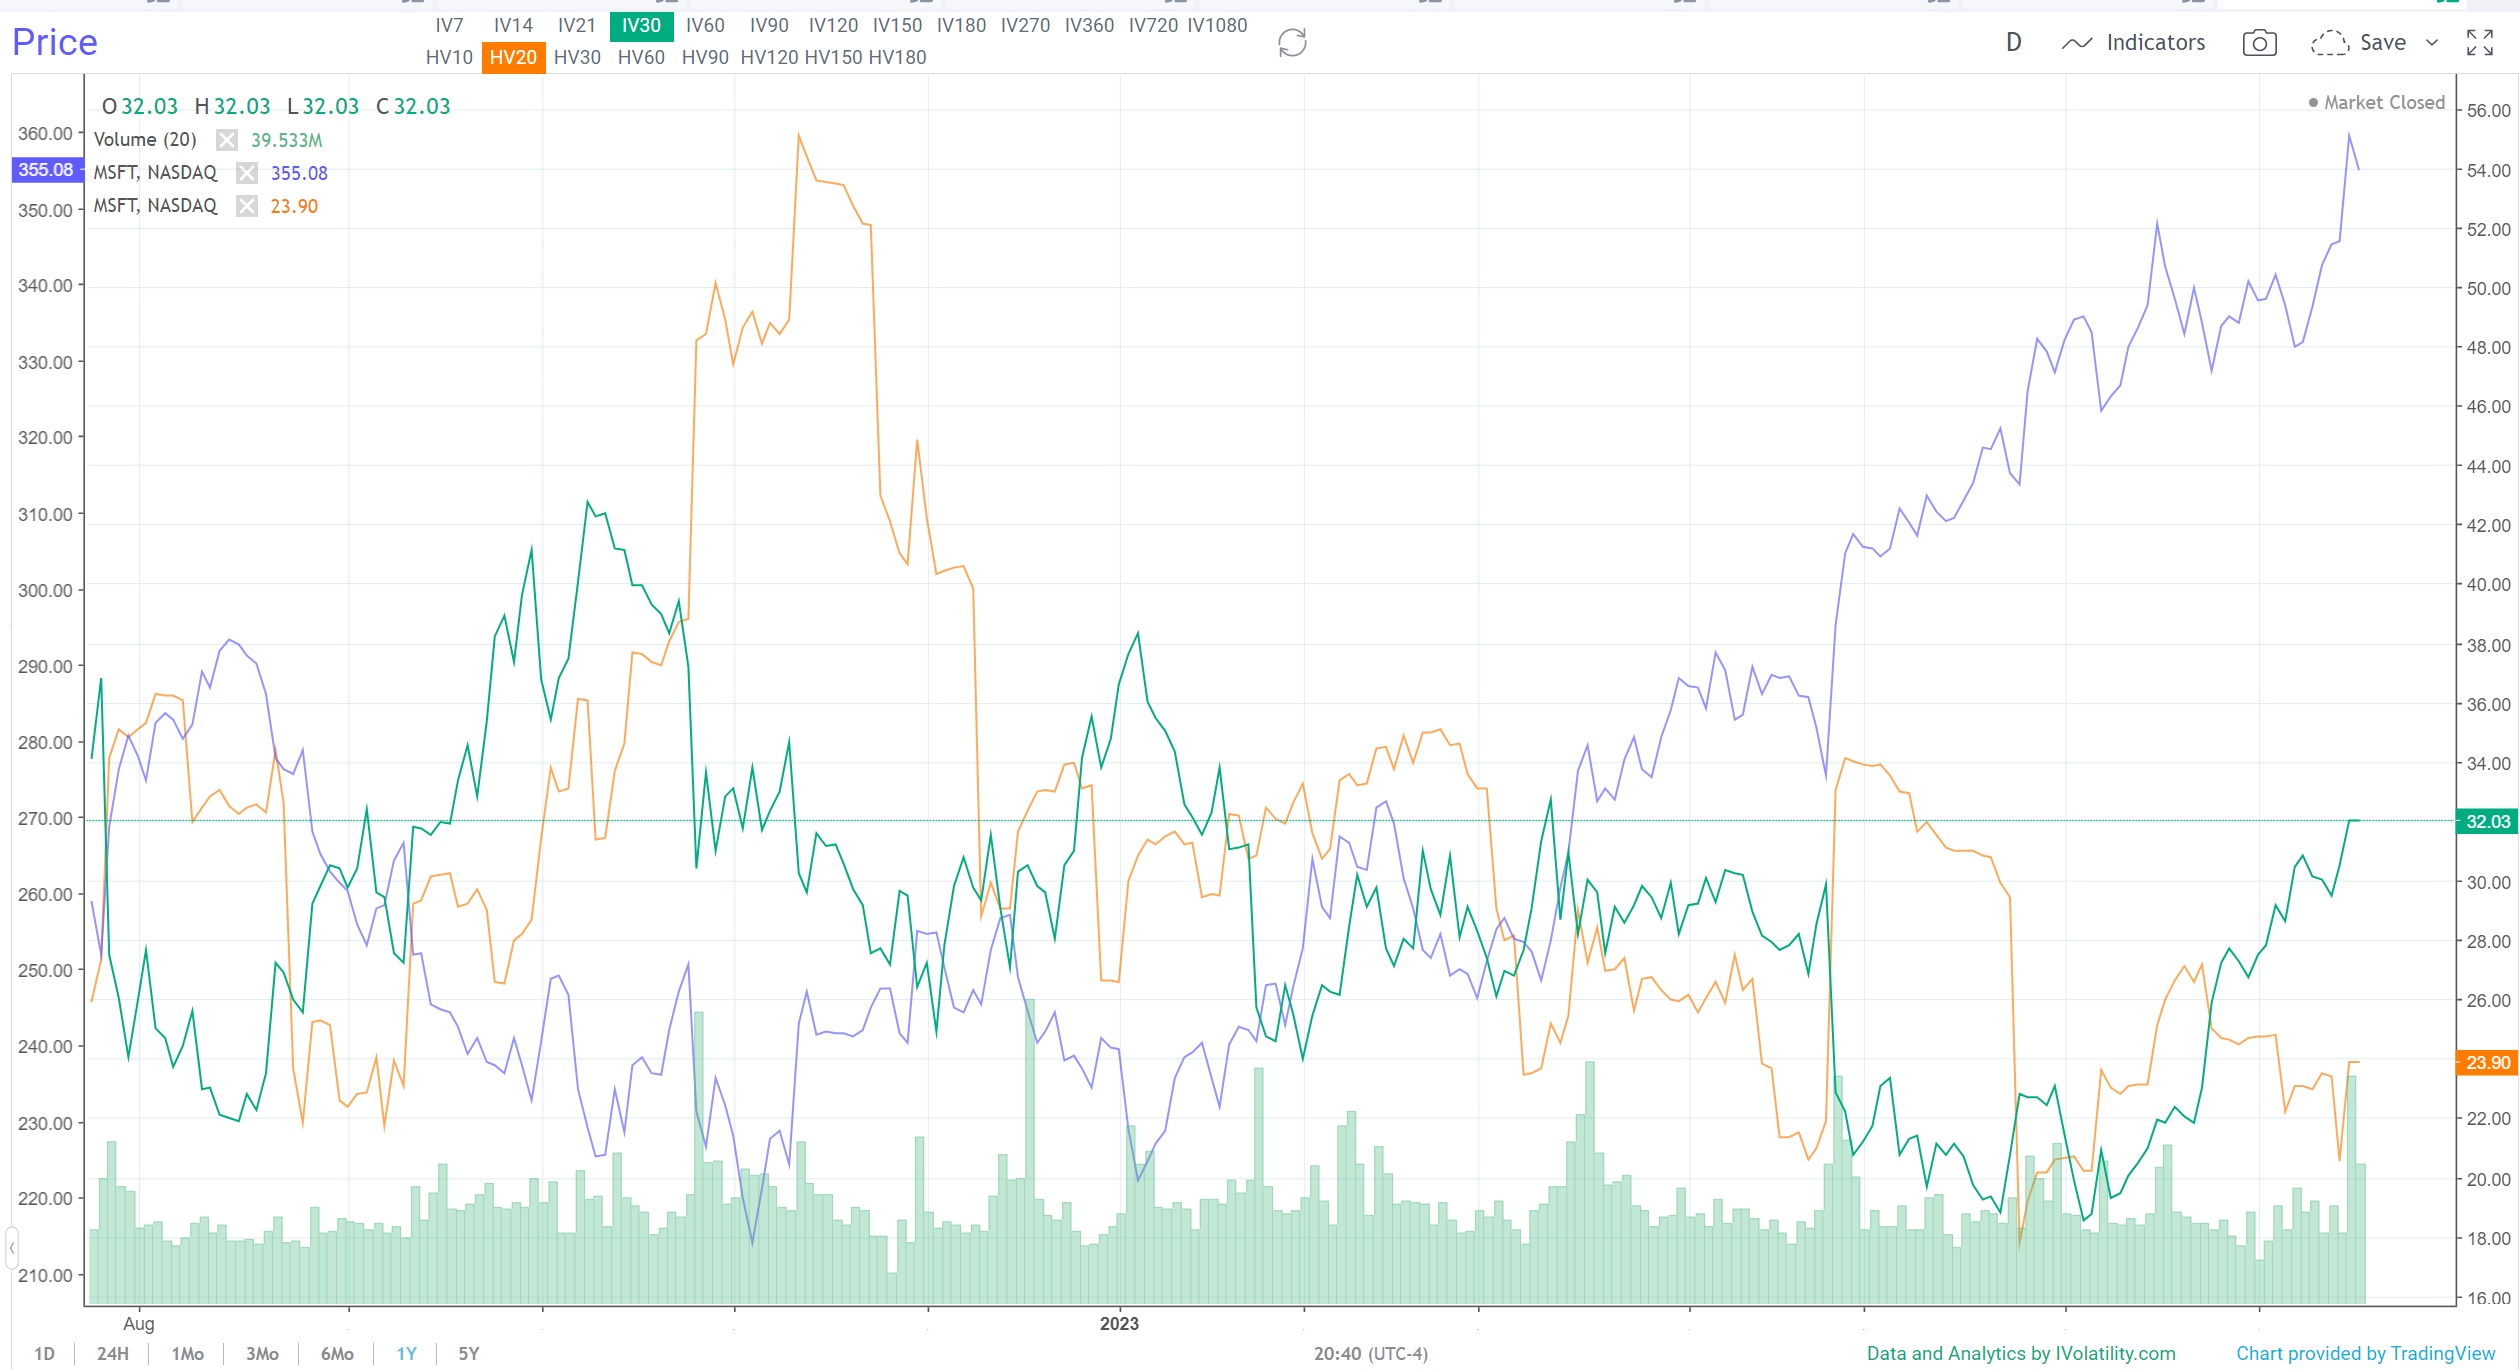
In the IVolLive chart above, we can see that Microsoft is rocketing higher while historical volatility (orange line) cruises lower. Implied Volatility (green line) recently bottomed out and headed higher, creating a reverse head and shoulders pattern.
Now that IV has broken above the upper neckline, we'll watch to see if it retraces or continues higher. If it continues higher, this will likely signal Microsoft is cooling off, and susceptible to dip in price.
If IV drops back below the neckline, this will likely translate into Microsoft shares continuing higher.
So, the question becomes... which way will IV break?
The good news is that we can use IVolLive as our market compass. This is another one-year chart of Microsoft. This time, we've isolated only the implied volatility and applied Bollinger Bands and the Relative Strength Index (RSI):
As you can see, IV is quite extended to the upside. It's close to kissing its upper Bollinger band and it's well above 70 on the RSI.
Translation: we'd bet on IV cooling off a bit in the weeks and months ahead. This means Microsoft could continue higher, even from these all-time highs.
How to Play It
Tech remains strong. However, not all tech is created equal. Drilling deeper, not all AI is created equal as well. Many companies are trying to jump on the AI bandwagon to move the needle.
Microsoft doesn't need a bandwagon. It has an army of entrenched customers who aren't going anywhere. They will happily pay the extra $30 per month per user, and Microsoft will happily continue raking in billions in cash flow quarter after quarter.
Previous issues are located under the News tab on our website.